Use these task cards in your maths class to have students independently analyse and interpret line graphs.
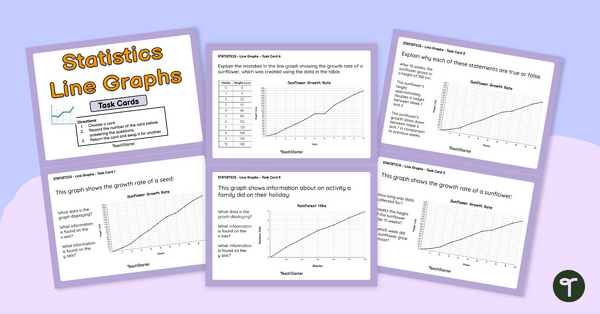
Interpret Line Graphs and Solve the Tasks!
Use this set of 25 line graph task cards to get students to interpret line graphs and apply their analytical skills to solve real-world scenarios. The graphs examined are themed age-appropriately, including graphs about gardening, pets and family holidays!
To use in your classroom, either laminate cards or attach them to sturdy cardboard. Instruct your students to choose a card and record the task card number in their books or on their recording sheet before recording the answers to the questions. You may choose to mark the answers before students can choose another card or students can replace the completed task card and choose another for it to be marked later.
Through this activity, students will show their ability to interpret line graphs representing change over time and discuss the relationships that are represented and conclusions that can be made.
Tips for Differentiation + Scaffolding
In addition to individual student work time, use these task cards as:
- Maths rotation or guided group
- lesson exit tickets
- a fast finisher activity
- homework assignments
- whole-class review (via smartboard)
Tips for Differentiation + Scaffolding
A team of dedicated, experienced educators created this resource to support your data and statistics lessons.
In addition to individual student work time, use this activity to enhance learning through guided maths groups, whole class lessons, or homework assignments.
If you have a mixture of above and below-level learners and ELL/ESL students, we have a few suggestions for keeping students on track with these concepts:
🆘 Support Struggling Students
Students could work collaboratively in pairs or small groups or with an adult to scaffold the activity.
➕ Challenge Fast Finishers
Students could create data tables for line graphs, they could turn all the false statements into true statements, graphs with mistakes can be redrawn correctly, students could collect their own data, draw the graph and ask questions to make their own task card as Task Card 25 suggests.
Easily Prepare This Resource for Your Students
Use the dropdown icon on the Download button to choose between the PDF or Google Slides version of this resource. A recording sheet and answer key are also included with this download.
Print on cardboard for added durability and longevity. Place all pieces in a folder or large envelope for easy access.
To keep the task cards out of pockets or under desks, punch a hole in the corner of each to place them on a binder ring.
Sustainability Tip: Print a few recording sheets on cardboard and slip them into write-and-wipe sleeves. Students can record their answers with a whiteboard marker, then erase and reuse them.
This resource was created by Leeanne Blanckensee, a teacher in Queensland and Teach Starter Collaborator.
Don’t stop there! We’ve got more interpreting graphs activities to reduce your lesson planning time:
Use these differentiated worksheets to practise using equations to create patterns within input-output tables and graphs. Use data analysis skills to analyse bar graphs and pictographs with this set of task cards. Use this board game to sharpen data analysis skills when solving problems with information presented in a single-unit picture or column graph.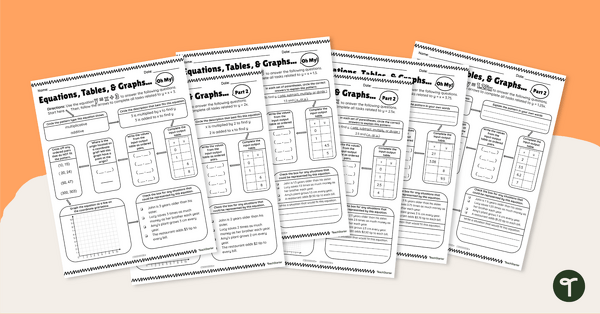
teaching resource
Equations, Tables, and Graphs, Oh My! – Differentiated Worksheets

teaching resource
Analysing Graphs – Single-Unit Bar Graphs and Pictographs – Task Cards
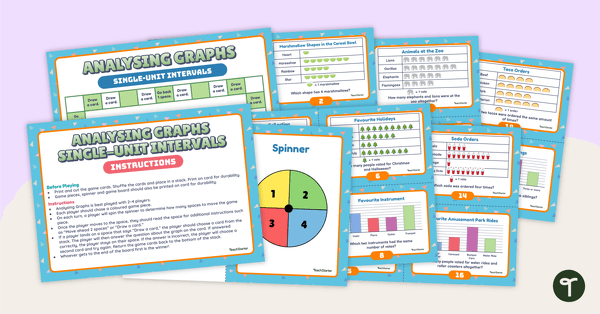
teaching resource
Analysing Graphs (Single-Unit Intervals) Board Game


0 Comments
Write a review to help other teachers and parents like yourself. If you'd like to request a change to this resource, or report an error, select the corresponding tab above.