Victorian Curriculum
VCMSP128
Create displays of data using lists, table and picture graphs and interpret them
Show more
7
teaching resources for those 'aha' moments
- Plus Plan

Types of Graphs Posters
This colourful and easy-to-digest visual display shows students the varying data displays they will encounter in their primary maths lessons.
- Plus Plan
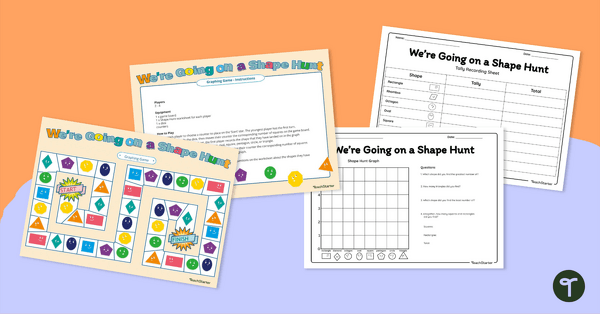
We're Going On a Shape Hunt! Graphing Game
Consolidate students' knowledge of 2D shapes while teaching about data collection, recording and graphing!
- Plus Plan
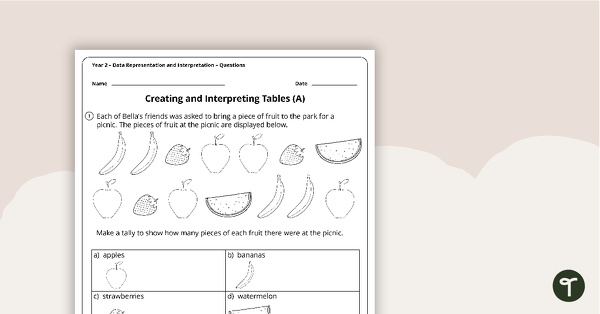
Data Representation and Interpretation Worksheets - Year 2
4 data representation and interpretation worksheets linked to the Australian Curriculum.
- Plus Plan
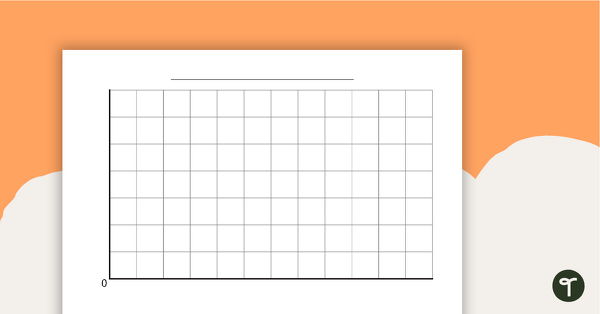
Blank Graph Template
A blank template for constructing graphs.
- Plus Plan

Maths Warm Ups Interactive PowerPoint - Year 2
A PowerPoint providing a series of warm up activities for Year 2 students across the curriculum.
- Plus Plan
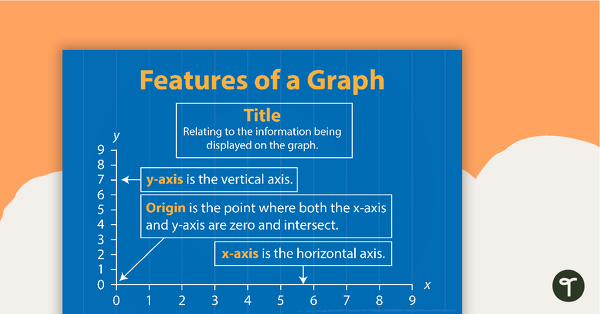
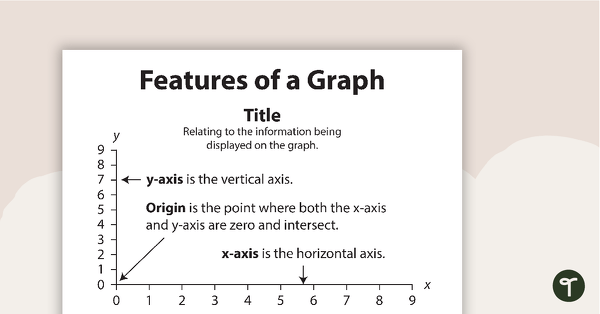
Features of a Graph
A poster showing the main features of a graph.
- Plus Plan
Features of a Graph BW
A poster showing the main features of a graph.