VCMSP179
Construct suitable data displays, with and without the use of digital technologies, from given or collected data. Include tables, column graphs and picture graphs where one picture can represent many data values
- Plus Plan

Types of Graphs Posters
This colourful and easy-to-digest visual display shows students the varying data displays they will encounter in their primary maths lessons.
- Plus Plan
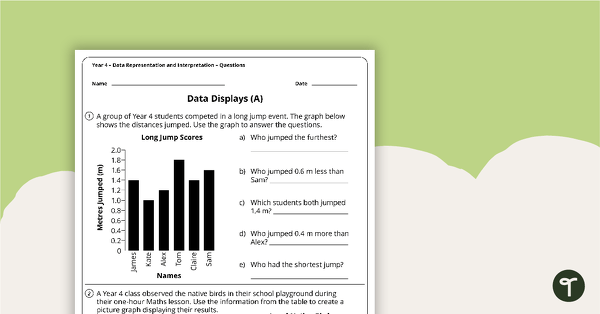
Data Representation and Interpretation Worksheets - Year 4
4 data representation and interpretation worksheets linked to the Australian Curriculum.
- Plus Plan

Types of Graphs Posters and Worksheets
A collection of posters displaying the different types of graphs along with matching worksheets to assist students with laying out graphs on the page.
- Plus Plan
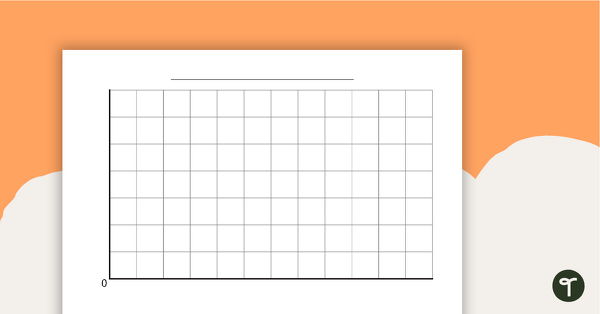
Blank Graph Template
A blank template for constructing graphs.
- Plus Plan

Data Maths Investigation - Which Reward?
A mathematics investigation involving data collection and representation, embedded in a real-world context.
- Plus Plan
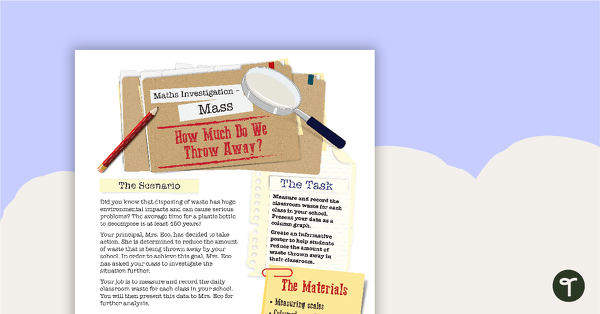
Mass Maths Investigation - How Much Do We Throw Away?
A mathematics investigation about measuring mass, embedded in a real-world context.
- Plus Plan
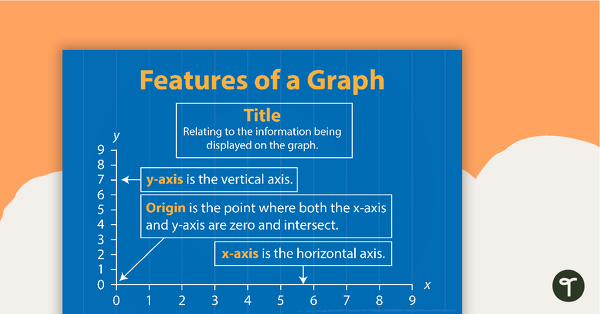
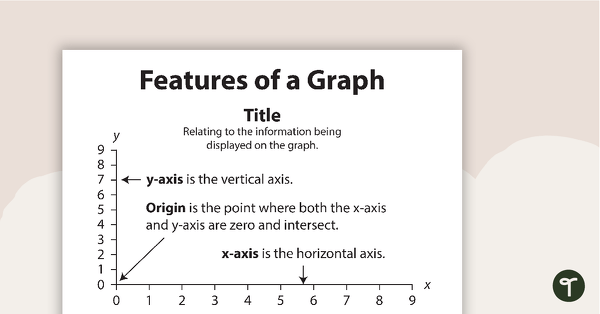
Features of a Graph
A poster showing the main features of a graph.
- Plus Plan
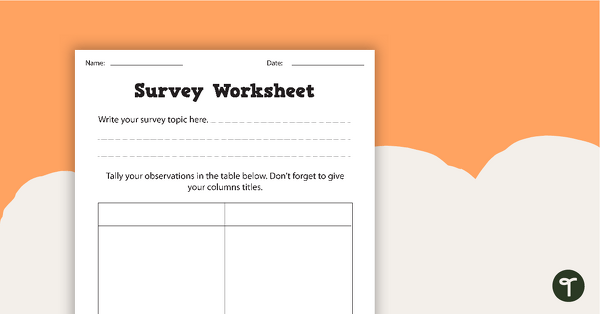
Survey Data Collection Worksheets
A set of worksheets for students to plan survey parameters and tally data.
- Plus Plan
Features of a Graph BW
A poster showing the main features of a graph.