Victorian Curriculum
VC2S4I04
data and information can be organised and represented to identify patterns and simple relationships by constructing tables, graphs and visual or physical models
- using graphic organisers to compare the properties of solids and liquids
- using virtual or role-play food chain simulations to investigate effects of the changing numbers of producers or consumers in a habitat
- constructing pictorial maps to illustrate the locations of different climates across Australia
- constructing a table that compares the measured distances moved by an object over surfaces that have different frictional forces
- constructing a column graph that records the properties of a range of natural and made materials
- using column graphs to show melting time for ice in containers with different insulating layers
Show more
5 of 37
teaching resources for those 'aha' moments
- Free Plan
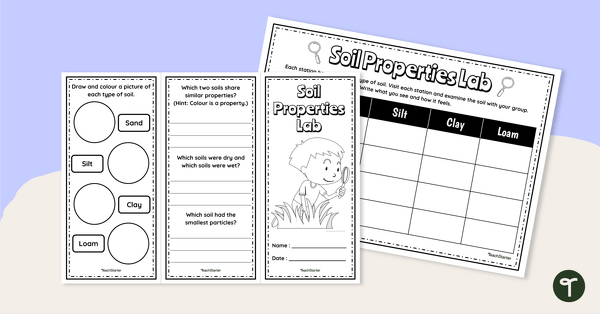
Soil Properties Lab – Brochure Template
Investigate different soil types and their properties with this hands-on activity.
- Plus Plan
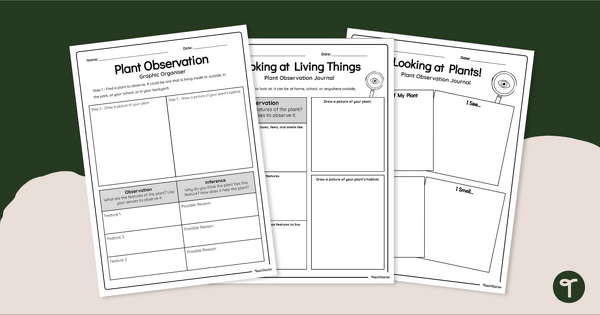
Plant Journal Observation Worksheets
Observe and record information about plants with a printable plant journal worksheet.
- Plus Plan
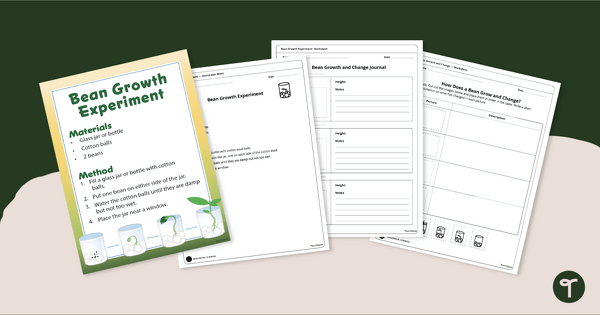
Lima Bean Experiment
“Grow” your students’ knowledge of plant life cycles with a plant growth experiment.
- Plus Plan
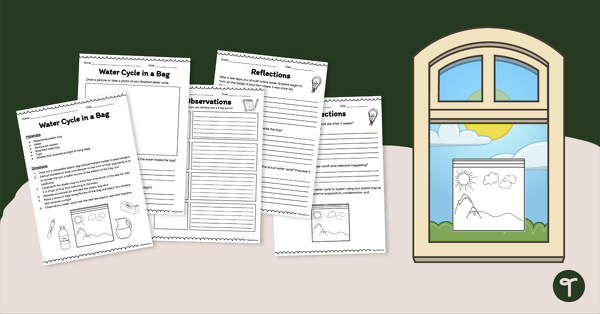
Water Cycle in a Bag – Investigation Activity
Create a water cycle in a bag, make observations, and answer discussion questions with this printable science activity.
- Plus Plan
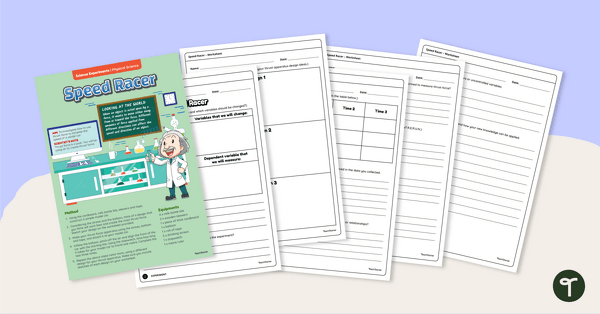
Balloon Car Experiment – Speed Racer
Use this hands-on balloon car experiment when teaching your Year 4 students about thrust force and its effect on the speed of objects.