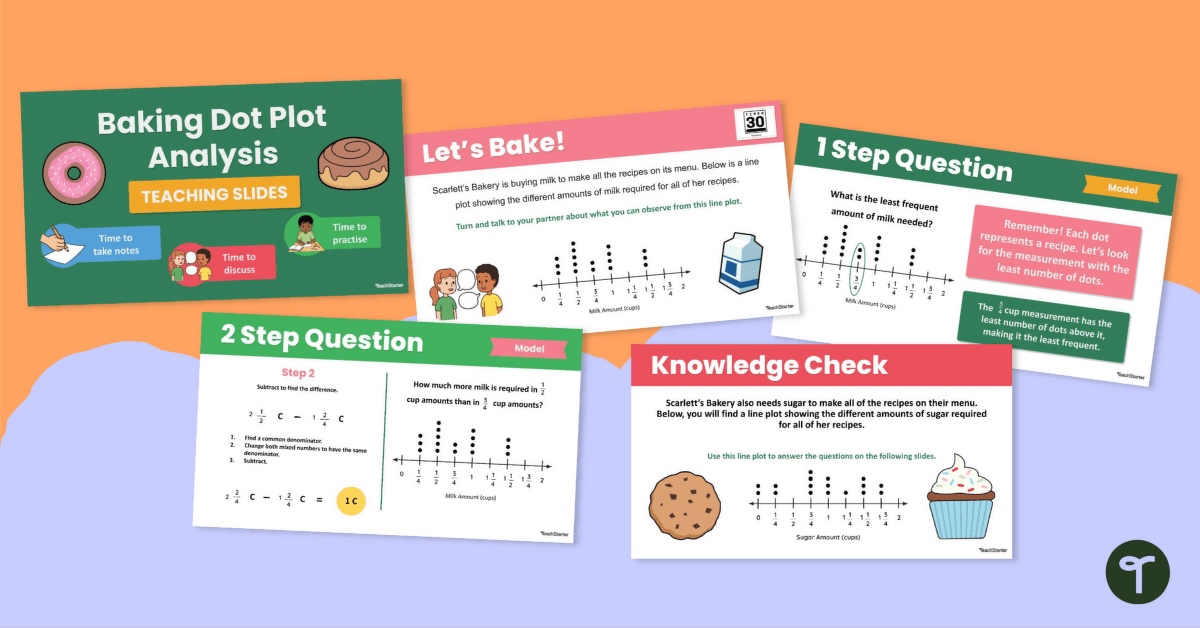
Explore the sweet side of graphs and data with this bakery-themed dot plot resource, supporting your students' abilities to interpret dot plots!
Dot Plot Analysis Resource with a Sweet Side!
Welcome to Baking Supplies Dot Plot Analysis, a digital resource that professional teachers have designed to help students learn how to analyse and interpret dot plots with ease. One of the benefits of interactive resources like this one is that it enables independence and allows students to take the reins of instruction. Through this interactive resource, students guide the learning process and explore the essential concept of dot plot analysis. Of course, we understand that each individual learns differently, so we have some differentiation tips below!
What’s Included in This Resource Download:
Our resource comprises a comprehensive set of slides designed to facilitate understanding and engagement:
- 1 Introductory Slide: Sets the stage for the learning journey, providing context and purpose.
- 13 Instructional Slides: These slides offer step-by-step guidance on dot plot analysis, breaking down the concept into manageable parts.
- 5 Knowledge Check Slides: These slides serve as checkpoints for students to assess their understanding and knowledge retention.
How to Use the Resource:
The first step is to hit that download button! Once you’ve saved a copy to your local storage, you can easily share it with your students. From there, using this resource is as simple as following the provided instructions on each slide. The teacher acts as a facilitator, moving through the slides and helping students engage with the content effectively.
One of the benefits of this resource is that it doesn’t require any additional tools. It’s ready to use, making it a hassle-free addition to your classroom.
Baking Supplies Dot Plot Analysis Resource is ideal for a whole-class activity. It can be used to engage the entire class, promoting collaborative learning and fostering a shared understanding of dot plot analysis.
Differentiation Strategies:
To ensure that all students’ needs are met, we offer some ideas for differentiation strategies:
- Challenge for Advanced Students: Advanced students can work through the “you do” slides independently, allowing them to dive deeper into the content at their own pace.
- Support for Struggling Students: For students who may be struggling to grasp the concept, consider offering additional small group support. Pull them aside for focused instruction to provide the assistance they need.
Our Baking Supplies Dot Plot Analysis resource is a versatile tool that encourages student-led learning while ensuring accessibility for all students. With this resource, students can develop their dot plot analysis skills and become more confident in their mathematical abilities in the area of graphing.
This teaching resource was created by Brittany Kellogg, a teacher and Teach Starter Collaborator.
Looking for More Graphs and Data Resources?
Make sure to check out some of our other graphs and data resources!
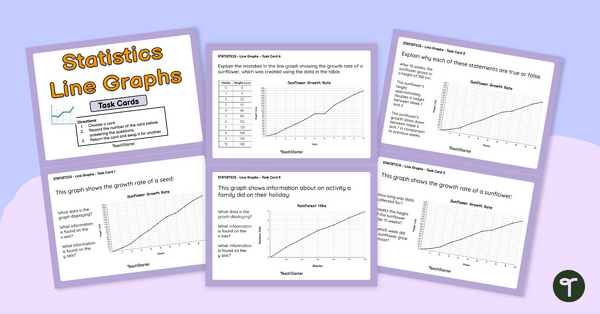
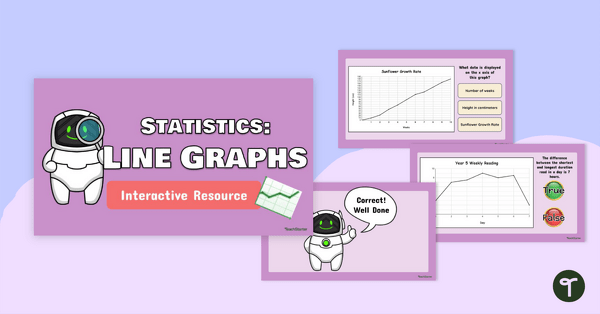
Use these task cards in your maths class to have students independently analyse and interpret line graphs. Solve the space man's line graph questions and complete the challenge with this interpreting line graphs interactive game!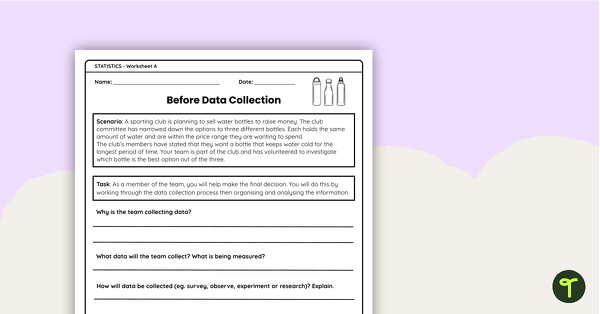
teaching resource
Interpreting Line Graphs Grade 5 Worksheet Set
teaching resource
Interpreting Line Graphs Task Cards Grade 5
teaching resource
Interpreting Line Graphs Interactive Activity Grade 5

0 Comments
Write a review to help other teachers and parents like yourself. If you'd like to request a change to this resource, or report an error, select the corresponding tab above.