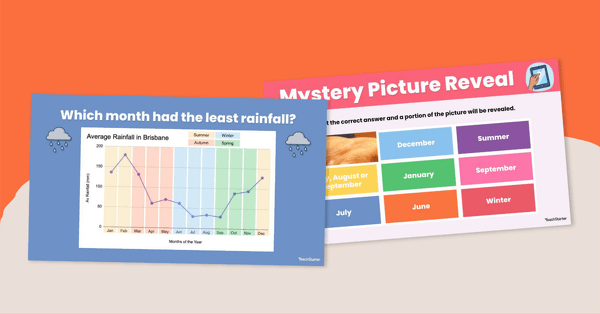
Use this digital activity to teach students about interpreting real-life data represented as a line graph showing how measurements change over a period of time.
Exploring Line Graphs Using Digital Technology
This colourful interactive activity is a fun and engaging way to help Grade 5 students practise interpreting real-life data represented as a line graph showing how measurements change over a period of time and making simple inferences.
Included in the download are:
- 39 slides
- 9 questions based on a graph
- 3 different line graphs
- You Got It and Oops Try Again feedback slides
Through this activity, students will use technology to access data sets and graphs to interpret line graph representations and discuss their findings.
How to Use This Line Graphs Activity:
- Have students read the statements at the top of the slides.
- Ask them to choose one of the responses inside the table.
- If the response is incorrect, a ‘Try Again’ slide will appear and students will be redirected so they can choose a different response. If the response is correct, a ‘You Got It’ slide will appear and students can progress to the next question.
- The next slide will appear with the previous answer box removed to reveal a portion of the mystery picture. A new question slide is presented will appear.
- This process repeats until all answers are completed and the mystery picture is fully revealed!
- Students can click the back arrow to return to the previous graph to help them answer the question.
Tips for Differentiation + Scaffolding
Our team of dedicated, experienced educators created this resource to support your data and graph lesson!
🆘 Support Struggling Students
Allow students to work in pairs or allow students to have a printed copy of the graphs so they won’t need to flick between screens.
➕ Challenge Fast Finishers
Students could write their own questions using the data in the graphs and make their own mystery picture reveal using a printed picture and sticky notes.
🧑🏫 Group Learning
Project the slides onto a screen and work through them as a class by having students record their answers in their notebooks or mini whiteboards.
Easily Prepare This Digital Resource for Your Students
Use the dropdown icon on the Download button to choose between the PowerPoint or Google Slides versions of this resource.
Assign this interactive activity in Google Classroom. Please be sure to open in Edit mode, not Presentation mode. Students click the correct answer rectangle to reveal the mystery picture.
This resource was created by Amy Adam, a teacher in Queensland and Teach Starter Collaborator.
We’ve got plenty more activities for your Grade 5 line graph lessons:
[resource:4991267] [resource:4991313] [resource:4991293 ]


0 Comments
Write a review to help other teachers and parents like yourself. If you'd like to request a change to this resource, or report an error, select the corresponding tab above.