Victorian Curriculum
VC2M6ST02
identify statistically informed arguments presented in traditional and digital media; discuss and critique methods, data representations and conclusions
- investigating data representations in the media and discussing what they illustrate and the messages the people who created them might want to convey
- evaluating reports and secondary data relating to the distribution and use of non-renewable resources around the world
- identifying potentially misleading data representations in the media; for example, graphs with broken axes or non-linear scales, graphics not drawn to scale, data not related to the population about which the claims are made and pie charts in which the whole pie does not represent the entire population about which the claims are made
- investigating both traditional and digital media relating to Aboriginal and Torres Strait Islander Peoples, identifying and critiquing statistically informed arguments
Show more
4
teaching resources for those 'aha' moments
- Plus Plan
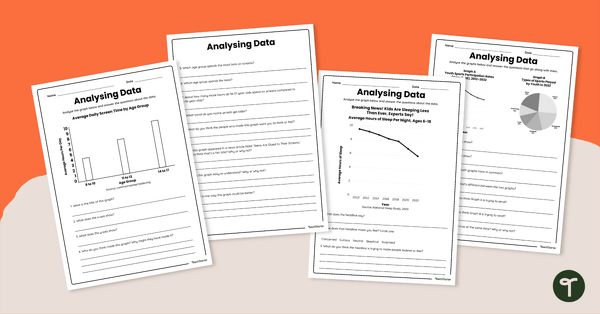
Analysing Data Worksheet Set
Share this analysing data worksheet set with your students to give them varied practice interpreting multiple data representations.
- Plus Plan
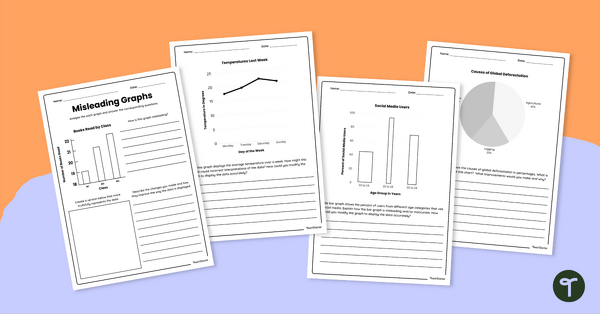
Misleading Graphs Worksheet Set
Download our misleading graphs worksheet set to increase your students’ abilities in statistical literacy and data analysis.
- Plus Plan
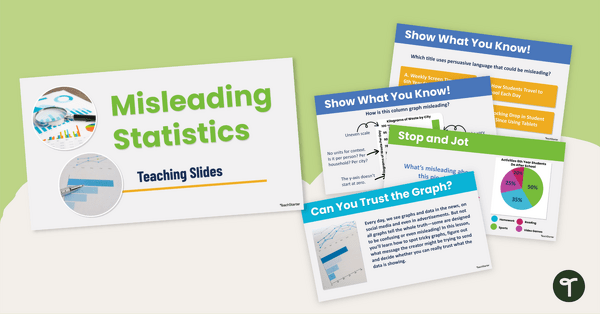
Misleading Statistics Teaching Slides
Use our misleading statistics teaching slides to increase statistical literacy and teach your students how to look at data displays with a critical eye.
- Plus Plan

Interpreting Data Year 6 Escape Room
Play our interpreting data year 6 escape room to give your students engaging practise identifying and correcting misleading data displays.