Track scientific changes over time with a set of printable Time Lapse Observation Charts.
Track Scientific Observations Over Time With Time Lapse Observation Charts
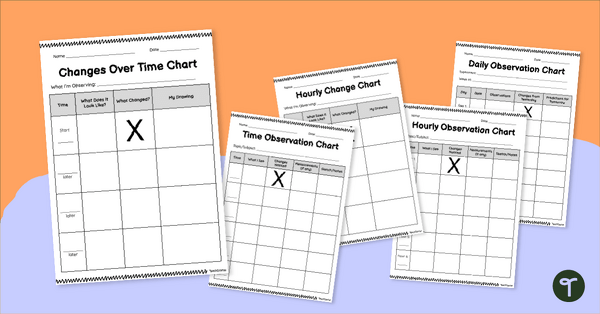
Help students slow down, look closely, and notice change with this set of time-lapse observation charts designed for classroom investigations. These printable templates provide students with a clear and structured way to track changes over time—whether they’re observing plant growth, melting ice, weather patterns, or conducting longer-term science experiments.
Seven Templates to Track Scientific Changes Over Time
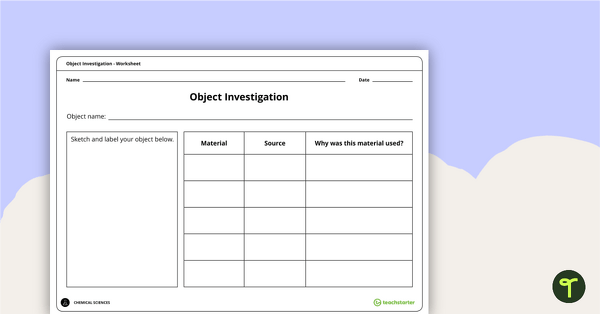
This resource includes seven versatile observation chart templates, each designed to support different lengths and types of investigations. Every Changes Over Time template provides space for students to:
- Record written observations at various intervals of time
- Collect and chart simple data
- Draw pictures to show the changes they observe over time
The open-ended format makes these charts easy to use across grade levels and science topics.
Download Your Science Observation Templates
These print-and-go templates are ideal when you need flexible tools at your fingertips. Use them for whole-class experiments, small-group science experiments, or independent science tasks. All you need to do is print, hand out, and guide students as they track their observations like real scientists.
This resource is available in both PDF and editable Google Slides format. To get your copy, click the dropdown arrow on the download button and choose your preferred file type.
This resource was created by Lindsey Phillips, a teacher and Teach Starter Collaborator.
More Printable Science Inquiry Activities and Resources
Looking to build even more inquiry skills in your classroom? Pair these time-lapse observation charts with hands-on experiments, prediction activities, and science inquiry activities to help students develop better observation, data-recording, and scientific thinking skills all year long.
teaching resource
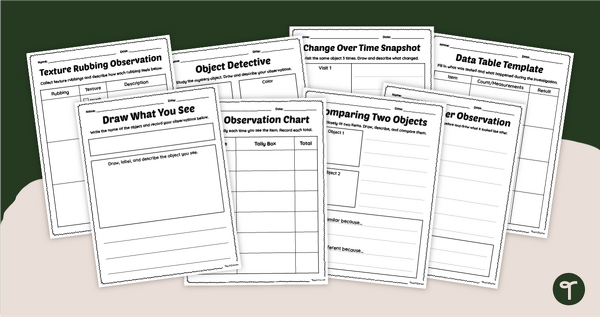
Scientific Observation Graphic Organisers
Record and organise scientific data with printable Scientific Observation Graphic Organisers for kids
teaching resource
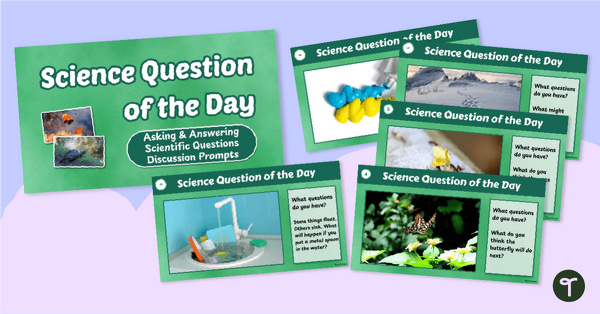
Science Question of the Day Discussion Prompts
Teach your students to ask questions, observe the world, and make scientific predictions with our Science Question of the Day Discussion Prompt Slide Deck.

0 Comments
Write a review to help other teachers and parents like yourself. If you'd like to request a change to this resource, or report an error, select the corresponding tab above.