Victorian Curriculum
VC2E6LA07
identify the ways that still images (such as figures, tables, diagrams, maps and graphs), moving images and sound are used in texts to create point of view
- observing how sequential events can be represented visually by a series of images, including comic strips, timelines, photo stories, procedure diagrams and flow charts, life cycle diagrams and the flow of images in picture books
- observing how concepts, information and relationships can be represented visually through tables, maps, graphs and diagrams
- understanding that images and maps may be sensitive for Aboriginal and Torres Strait Islander Peoples and ensuring that a disclaimer is applied or judgement is used about cultural appropriateness and sensitivities
Show more
2
teaching resources for those 'aha' moments
- Plus Plan
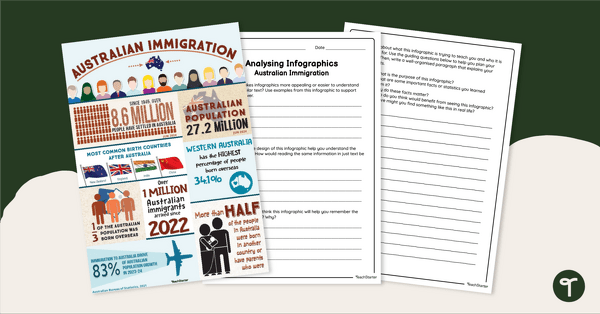
Australian Immigration – Analysing Infographics Worksheet
Explore Australian immigration trends with your students by analysing a kid-friendly infographic and answering guided questions.
- Plus Plan

Visual Comprehension Slide Deck
Bring visual comprehension to life in your classroom with this engaging slide deck designed to spark critical thinking and boost student engagement.