Australian Curriculum V8
ACMSP148
Interpret secondary data presented in digital media and elsewhere
Elaborations
- investigating data representations in the media and discussing what they illustrate and the messages the people who created them might want to convey (Skills: Literacy, Numeracy, Critical and Creative Thinking, Ethical Understanding)
- identifying potentially misleading data representations in the media, such as graphs with broken axes or non-linear scales, graphics not drawn to scale, data not related to the population about which the claims are made, and pie charts in which the whole pie does not represent the entire population about which the claims are made (Skills: Literacy, Numeracy, Critical and Creative Thinking, Ethical Understanding)
Show more
3
teaching resources for those 'aha' moments
- Plus Plan
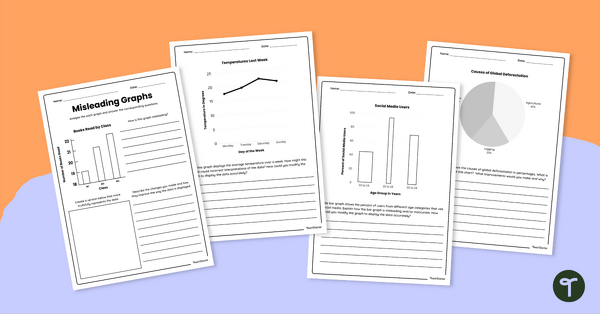
Misleading Graphs Worksheet Set
Download our misleading graphs worksheet set to increase your students’ abilities in statistical literacy and data analysis.
- Plus Plan
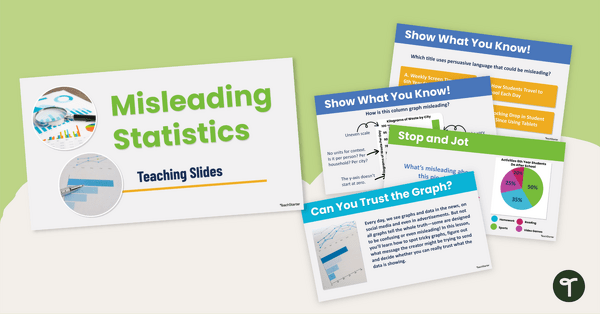
Misleading Statistics Teaching Slides
Use our misleading statistics teaching slides to increase statistical literacy and teach your students how to look at data displays with a critical eye.
- Plus Plan

Interpreting Data Year 6 Escape Room
Play our interpreting data year 6 escape room to give your students engaging practise identifying and correcting misleading data displays.