Guide your students to represent data with this differentiated line plot worksheet.
What Are Line Plots?
As soon as students enter school, they begin to learn about different ways to organise and represent data. They learn how to show information with bar graphs, pictographs, dot plots and more. Another type of graph students will encounter is a line plot. If you are looking for an easy way to explain this type of data representation to your students, read on!
A line plot is like a picture showing how many different things happen. It uses a line with little ‘X’ marks to show the numbers. For example, if students ask their friends about their favourite fruits and get the answers, we can make a line plot to see which fruit is the most popular. Each ‘X’ on the line plot represents one student who likes that fruit. It helps us understand the data in a fun and easy way!
What’s Included?
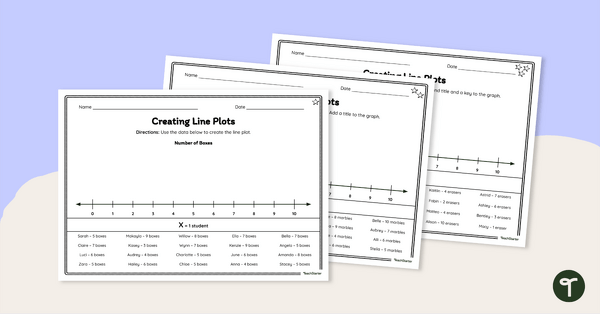
Teach Starter has created a differentiated worksheet that your students can use to practise creating a line plot. Each version (as noted with 1, 2 or 3 stars in the upper right corner) will give your students the practise they need.
- One Star – Students will only plot the data points
- Two Stars – Students will plot the data points and title the graph
- Three Stars – Students will plot the data points, title the graph and create a key
An answer key is included with your download to make grading fast and easy!
Differentiation + Scaffolding Tips
In addition to independent student work time, use this worksheet as an activity for:
- Whole-class activity (via smartboard)
- Homework activity
- Assessment
For students that need a bit of a challenge, encourage them to create 3-5 questions based on the line plot they created. Students can then trade with a classmate if they wish. Additionally, provide students the level 3 version of the worksheet.
If there are students in need of support, provide them with the 1-star version of this worksheet. Encourage students to cross off each data point as they place it on the line plot.
Easily Download & Print Your Line Plot Worksheets
Use the dropdown icon on the Download button to choose between the PDF or editable Google Slides version of this resource.
Because this resource includes an answer sheet, we recommend you print one copy of the entire file. Then, make photocopies of the blank worksheet for students to complete.
Turn this teaching resource into a sustainable activity by printing on thick card and slipping it into a dry erase sleeve. Students can record their answers with a whiteboard marker, then erase and reuse them.
This resource was created by Brittany Kellogg, a Teach Starter Collaborator.
Don’t stop there! We’ve got more activities to shorten your lesson planning time:
teaching resource
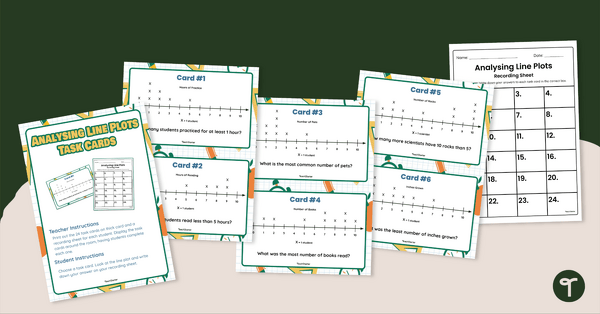
Analysing Dot Plots Task Cards
Strengthen data analysis skills by interpreting dot plots with this set of 24 task cards.
teaching resource
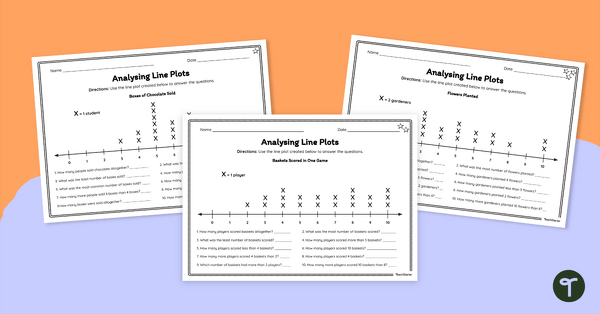
Analysing Line Plots – Differentiated Worksheets
Empower your students to become proficient data interpreters with this set of differentiated line plot worksheets.

teaching resource
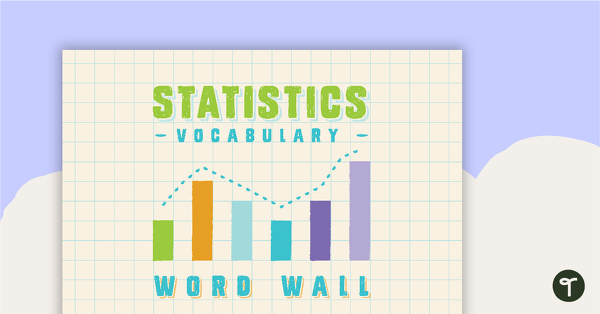
Types of Graphs Posters
Show students the varying data displays they will encounter in their primary maths lessons with these colourful and easy-to-digest visual posters.


0 Comments
Write a review to help other teachers and parents like yourself. If you'd like to request a change to this resource, or report an error, select the corresponding tab above.