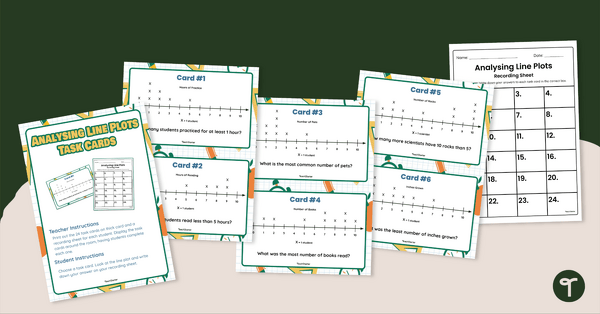
Strengthen data analysis skills by interpreting dot plots with this set of 24 task cards.
Why Learn to Read a Dot Plot?
As your students begin exploring data and graphs in Maths, it’s important they first become confident in interpreting one type of graph before they’re expected to compare different representations. Analysing and answering questions about a dot plot is a critical stepping stone, even if it isn’t explicitly called out in the curriculum, as it builds the skills needed to master higher-order expectations like selecting which type of graph best suits a particular dataset.
A dot plot is a simple, visual way of displaying data along a number line. Each dot shows a piece of data, stacked above its corresponding value. They’re perfect for helping students make sense of smaller sets of information and begin drawing conclusions from what they see.
Dot Plot Task Cards for Years 2
Give your students the opportunity to practise reading and analysing dot plots with this set of 24 engaging task cards.
- Wide variety of real-world dot plots so students encounter different datasets and contexts
- Built-in differentiation — 18 cards using single-unit intervals and 6 using scaled intervals for an extra stretch
- Recording sheet included for easy tracking and assessment.
Flexible Classroom Use
Choose from two classroom-friendly ways to use this resource:
- Maths rotations / small groups – Perfect for independent or guided skills practise
- ‘Scoot’ style whole-class activity – Get students moving around the room, answering different dot plot questions and rotating when you call “Scoot!”
Easy Prep
- Download as PDF or Google Slides
- Includes a recording sheet and answer key
- Print the task cards on thick card for durability and store in a folder or envelope for easy access.
This resource was created by Brittany Kellogg, a Teach Starter Collaborator.
Don’t stop there! We’ve got more activities and resources that cut down on lesson planning time:
[resource:3297726] [resource:4963853] [resource:4961213]


0 Comments
Write a review to help other teachers and parents like yourself. If you'd like to request a change to this resource, or report an error, select the corresponding tab above.