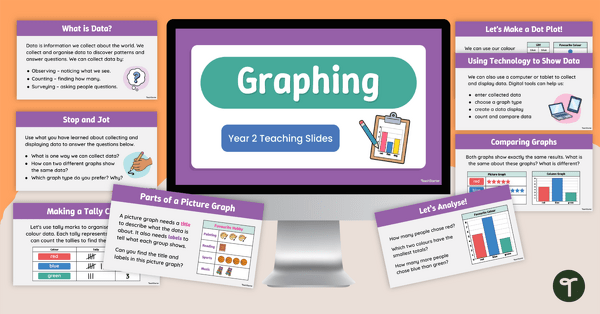
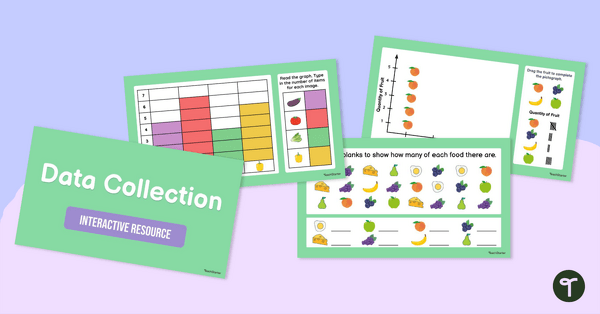
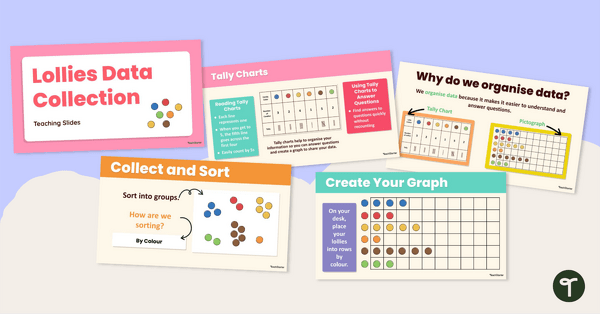
Teach data and graphing with an engaging Year 2 teaching presentation that helps students collect, organise, represent and interpret data using a variety of graphing formats.
Data and Graphing Teaching Slides for Year 2
Build students’ confidence with data and graphing concepts using this engaging Year 2 Graphing Teaching Presentation. Through interactive discussions, worked examples and analysis activities, students learn how to collect data, ask meaningful questions and organise information in ways that make it easy to interpret and compare.
Students explore different methods of data collection, including observations, counting and surveys, before learning how to record and organise data using lists and tally charts. The presentation then introduces a range of data displays, including picture graphs, column graphs and dot plots, helping students understand the purpose and features of each graph type.
Throughout the slides, students analyse data, answer questions, compare results and discuss which graphing methods are most effective for displaying information. The resource also includes opportunities to explore how technology can be used to collect, organise and display data.
Engaging Ways to Use These Data and Graphing Slides
Use this teaching presentation in a variety of meaningful ways throughout your data and graphing unit:
- Class Surveys – Poll students on favourite foods, colours or hobbies, then use the results to create tally charts and graphs.
- Graph Detectives – Have students analyse the graphs in the presentation and justify their answers using data evidence.
- Data Around Us – Challenge students to collect their own classroom data and decide which graph type best represents the results.
Download These Data and Graphing Teaching Slides
This resource is available as a ready-to-download PowerPoint file and an editable Google Slides version.
Simply click the download button to access your preferred file format. Please note that you will be prompted to make your own copy of the Google Slides file before editing.
This resource was created by Lindsey Phillips, a TeachStarter collaborator.
More Data and Graphing Resources
Explore more data and graphing resources below to help students collect, organise, represent and interpret data with confidence.
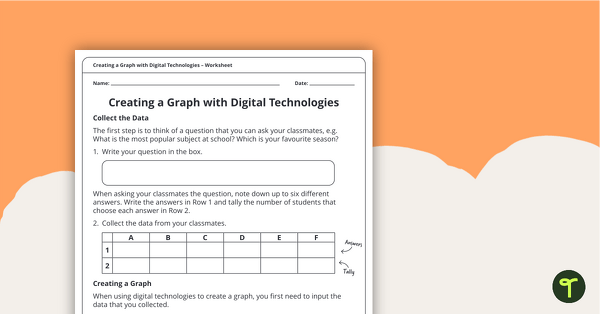
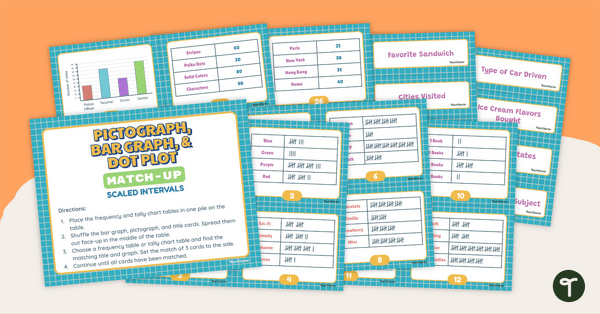
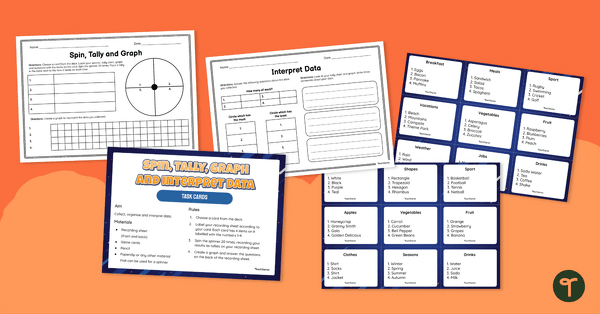
[resource:4470725] [resource:4855538] [resource:4854]

0 Comments
Write a review to help other teachers and parents like yourself. If you'd like to request a change to this resource, or report an error, select the corresponding tab above.