teaching resource

Line Plots / Dot Plots - Year 5 Assessment

  • Updated

    Updated:  14 Jun 2024

Assess student understanding of reading and creating dot plots/line plots with a printable assessment for Year 5.

  • Editable

    Editable:  Google Slides

  • Non-Editable

    Non-Editable:  PDF

  • Pages

    Pages:  1 Page

  • Curriculum
  • Year

    Year:  5

Curriculum

  • VC2M5ST01

    Acquire, validate and represent data for nominal and ordinal categorical and discrete numerical variables to address a question of interest or purpose using software including spreadsheets; discuss and report on data distributions in terms of highest frequency (mode) and shape, in the context of the data <ul> <li>recognising that ordinal data is a form of categorical data even though the data being collected might be numbers, for example, a rating scale using numbers 1–5 to represent the categories people can choose from when asked, ‘What rating would you give this film out of 5?’</li> <li>determining the mode for a set of data and discussing that there may be more than one mode</li> <li>identifying the best methods of presenting data to illustrate the results of investigations and justifying the choice of representations</li> <li>acquiring data through chance experiments, discussing and reporting on the distribution of outcomes and how this relates to equal and unequal outcomes</li> <li>using digital systems to validate data; for example, recognising the difference between numerical, text and date formats in spreadsheets, and setting data types in a spreadsheet to make sure a date is input correctly</li> <li>investigating data relating to the reconciliation process between Aboriginal and Torres Strait Islander Peoples and non-Indigenous Australians, posing questions, discussing and reporting on findings</li> </ul>

teaching resource

Line Plots / Dot Plots - Year 5 Assessment

  • Updated

    Updated:  14 Jun 2024

Assess student understanding of reading and creating dot plots/line plots with a printable assessment for Year 5.

  • Editable

    Editable:  Google Slides

  • Non-Editable

    Non-Editable:  PDF

  • Pages

    Pages:  1 Page

  • Curriculum
  • Year

    Year:  5

Assess student understanding of reading and creating dot plots/line plots with a printable assessment for Year 5.

Let’s Take a Year 5 Line Plot/ Dot Plot Test!

Are you looking for a printable resource to assess student mastery of 5th grade measurement and data standards? Whether you call them line plots or dot plots, sometimes it’s hard to find the best resources and assessments for guiding your students through this area of the curriculum. No worries, though; Teach Starter has a comprehensive and rigorous assessment ready for use in your classroom!

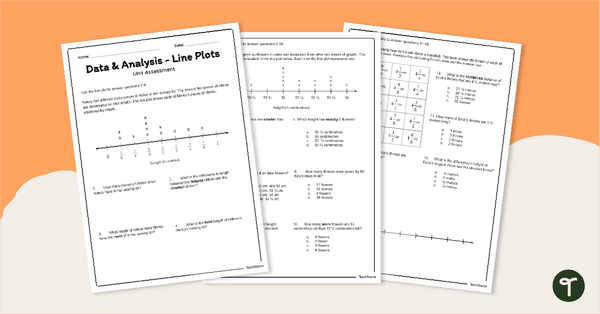
The assessment has 15 questions. Students must complete the following types of Year 5 line plot problems.

  • Read a line plot with fractional increments and answer questions using data from the line plot.
  • Convert a data table into a line plot with fractional increments
  • Create a line plot using data in fraction increments

Students should complete the assessment independently to demonstrate mastery of these standards. This would also serve as a great review prior to a Year 5 Line Plot assessment; just edit the title!

An answer key is included with your download to make grading fast and easy!

Download and Print Your Dot Plot Assessment for Year 5

Use the dropdown icon on the Download button to choose between the PDF or editable Google Slides version of this resource.

Because this resource includes an answer sheet, we recommend you print one copy of the entire file. Then, make photocopies of the blank worksheet for students to complete.


This resource was created by Liz Whitaker, a teacher and Teach Starter Collaborator.


Don’t stop there! We’ve got more activities to shorten your lesson planning time:

Image of Line Plot Bakery Interactive Activity

teaching resource

Line Plot Bakery Interactive Activity

Assign this bakery-themed interactive activity to your students to build their understanding of analyisng and creating line plots.

Teach Starter Publishing1 pageYears: 4 - 5
Image of Analysing Line Plots Task Cards

teaching resource

Analysing Line Plots Task Cards

Strengthen data analysis skills by interpreting line plots with this set of 24 task cards.

Teach Starter Publishing1 pageYears: 2 - 3
Image of Analysing Line Plots – Differentiated Worksheets

teaching resource

Analysing Line Plots – Differentiated Worksheets

Empower your students to become proficient data interpreters with this set of differentiated line plot worksheets.

Teach Starter Publishing1 pageYears: 2 - 3

0 Comments

Write a review to help other teachers and parents like yourself. If you'd like to request a change to this resource, or report an error, select the corresponding tab above.

Log in to comment

You may also like