
Check your students’ understanding of interpreting data and using it to create graphs using this fun and colourful interactive game.
Using Data to Create Graphs!
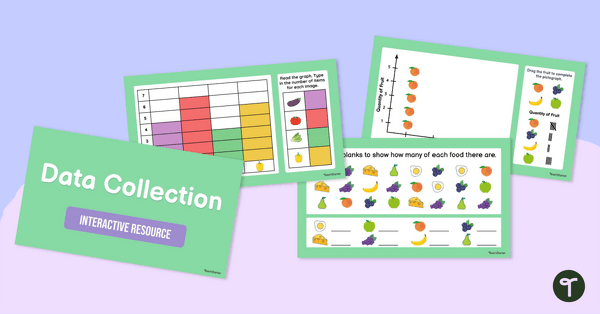
If you’re looking for an engaging activity to help your students learn how to interpret data and create their own graphs, this 8-slide interactive activity will be the perfect addition to your next maths lesson!
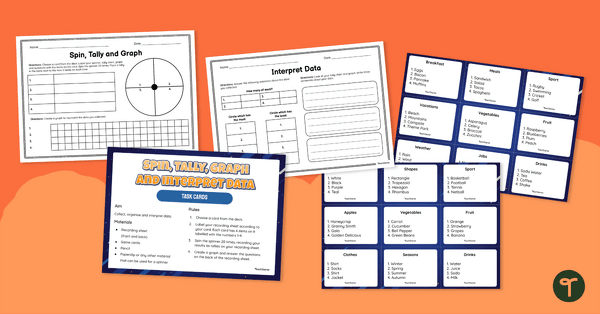
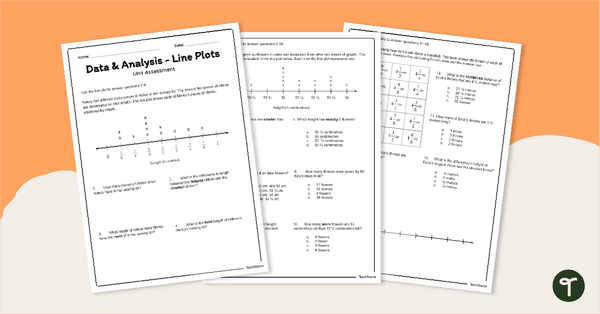
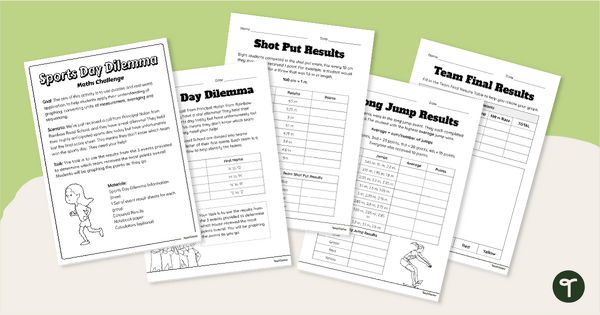
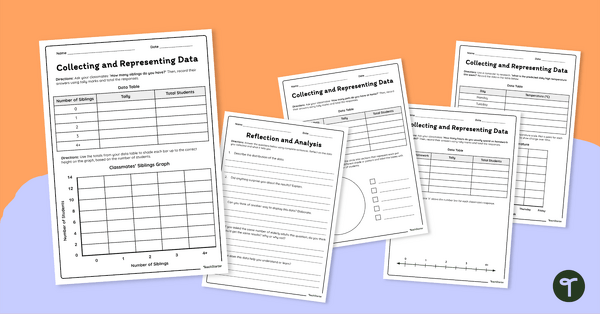
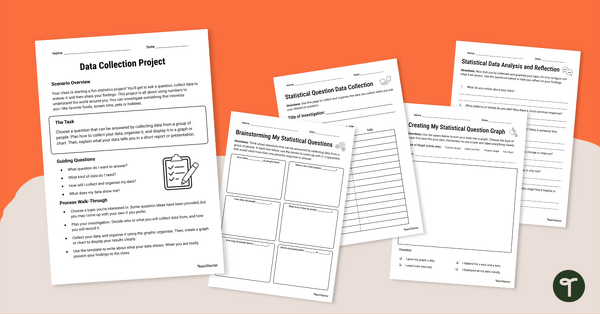
This series of tasks requires students to read the provided data and use that information to complete graphs.
Throughout this activity, students will create simple pictographs, bar graphs and tally charts. Use it as a formative assessment to check how your students are going with these concepts.

How to Use This Interactive Graph Activity
Hit that download button and copy this digital graphs and data activity (it’s editable, so you can change things up for an added challenge or scale back for kids who need extra support).
Next, either assign the resource by sending it to your students’ devices or computers or share it on your smart board for a whole group activity. Make sure you open the resource (or instruct your kids to) in Edit mode, not Presentation mode, so they can drag and drop to complete each activity.
This resource was created by Kaylyn Chupp, a teacher and Teach Starter collaborator.
Are You Searching for More Great Graphing Activities?
We have plenty! Take a look at these ones:
Show students the varying data displays they will encounter in their primary maths lessons with these colourful and easy-to-digest visual posters. Consolidate students' knowledge of 2D shapes while teaching about data collection, recording and graphing! Use this set of task cards students to practise interpreting column graphs, histograms and line plots.
teaching resource
Types of Graphs Posters
teaching resource
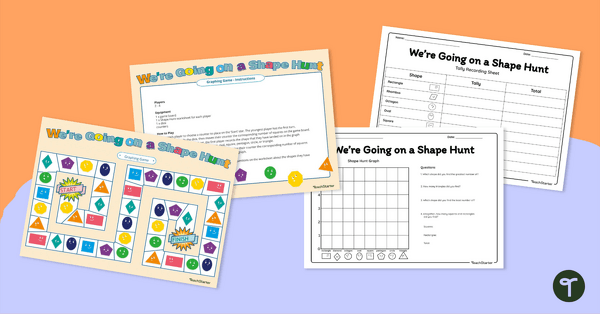
We're Going On a Shape Hunt! Graphing Game
teaching resource
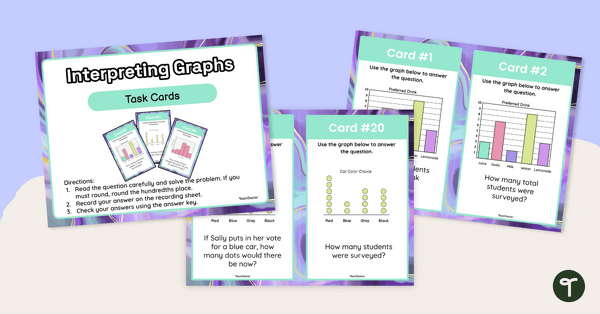
Interpreting Graphs Task Cards


The Interactive mode doesn't work.
Hi Bec, Thanks for reaching out! To use this resource, you'll need to make sure you're in edit mode (not present mode) so yourself/your kids can drag and drop to complete each activity. If you still have anything questions to ask with this, please don't hesitate letting our team know via the support link. Thanks!