Statistics
- Plus Plan
Blank Graph Template
A blank template for constructing graphs.
- Plus Plan
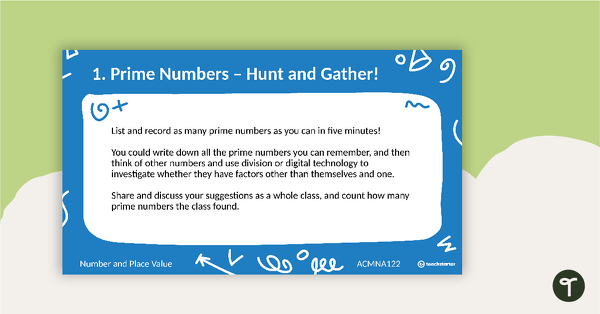
Maths Warm Ups PowerPoint - Year 6
A PowerPoint providing a series of warm up activities for Year 5 students across the curriculum.
- Plus Plan
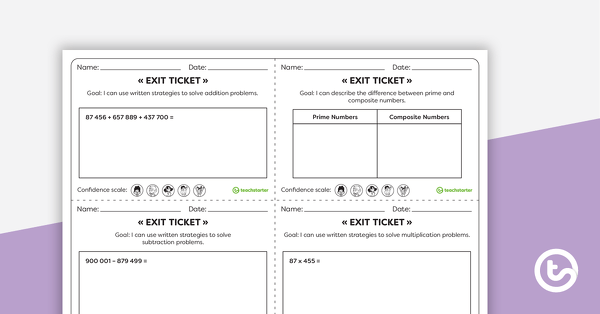
Year 6 Numeracy Exit Tickets – Worksheets
23 Numeracy Exit Ticket activities for students to provide evidence of their learning progress.
- Plus Plan
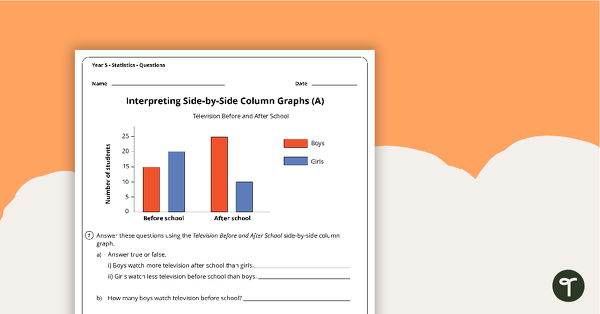
Statistics Worksheets - Year 5
10 statistics worksheets linked to the National Curriculum in England.
- Plus Plan
Maths Warm Ups PowerPoint - Year 5
A PowerPoint providing a series of warm up activities for Year 5 students across the curriculum.
- Plus Plan
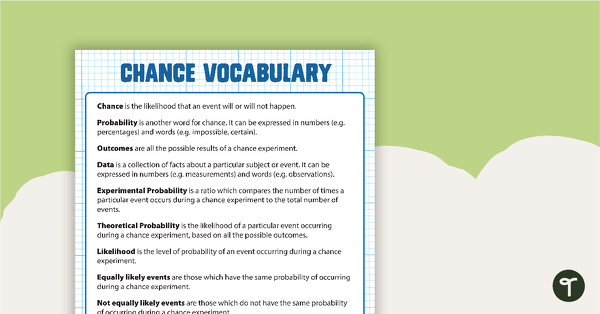
Chance Vocabulary Definitions
A poster with a set of chance vocabulary words and associated definitions.
- Plus Plan
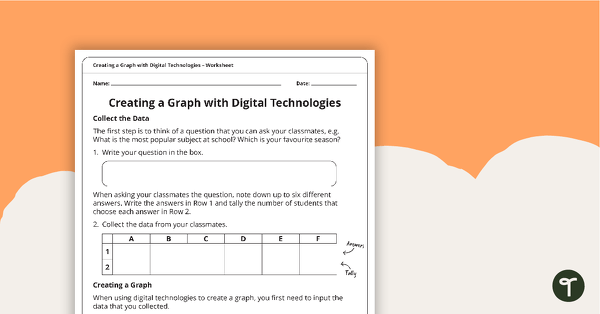
Creating a Graph Using Digital Technologies
A worksheet that supports students when collecting initial data and creating a digital graph.
- Plus Plan
Sports Day Dilemma - Numeracy Whole Class Game
A whole class game that consolidates your students’ knowledge of measurement and graphing concepts – in a fun way!
- Plus Plan
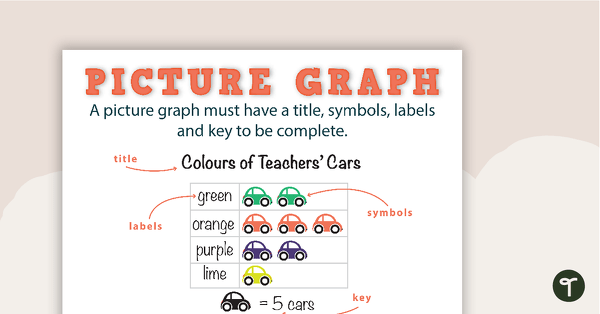
Types of Graphs Posters with Labels
6 posters showing the features and examples of picture graphs, pie charts, line graphs, bar graphs, column graphs and histograms.
- Plus Plan
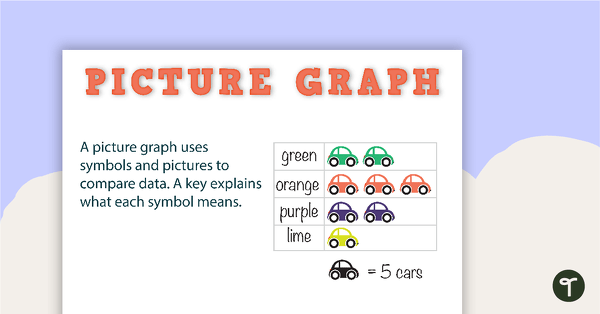
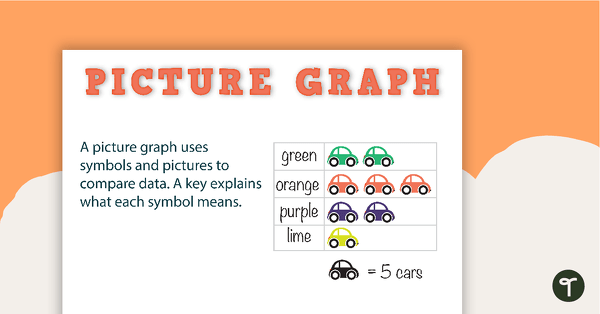
Types of Graphs Posters
6 posters showing the features and examples of picture graphs, pie charts, line graphs, bar graphs, column graphs and histograms.
- Plus Plan
Types of Graphs Posters and Worksheets
A collection of posters displaying the different types of graphs along with matching worksheets to assist students with laying out graphs on the page.
- Plus Plan
Features of a Graph BW
A poster showing the main features of a graph.
- Plus Plan
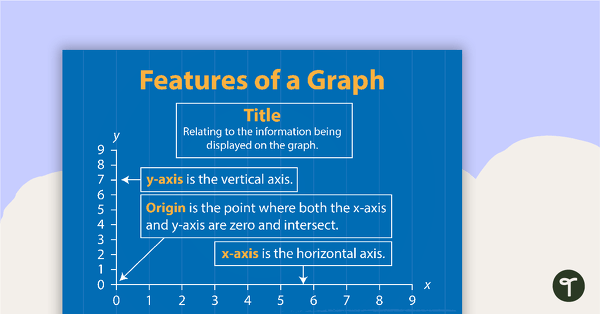
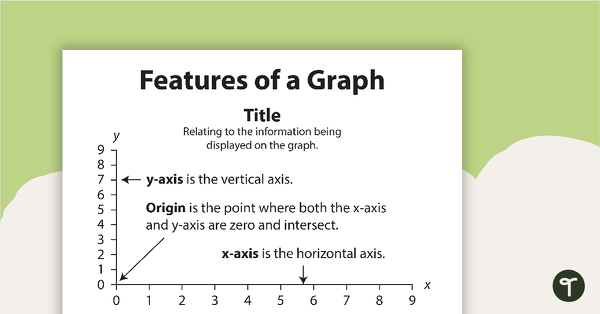
Features of a Graph
A poster showing the main features of a graph.
- Plus Plan
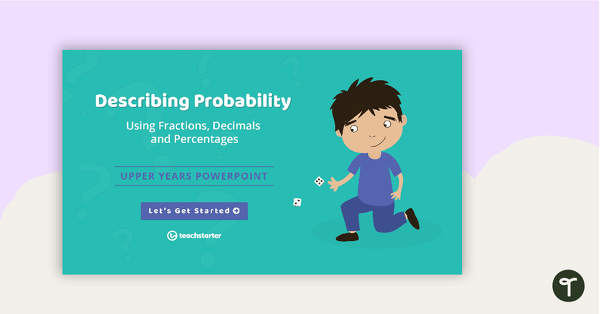
Chance and Probability Upper Years PowerPoint
An engaging 30 slide interactive PowerPoint to use in the classroom when learning about chance and probability in the upper years.
- Plus Plan
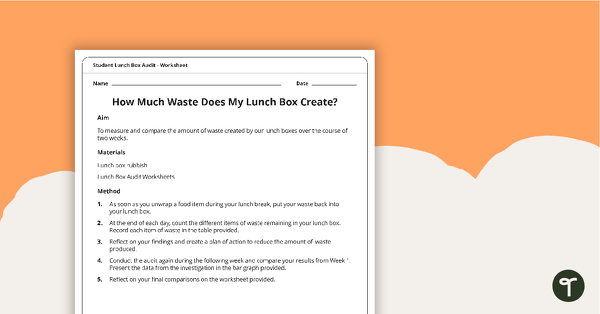
Student Lunch Box Audit Worksheet
An investigation that will have students calculating the waste produced from their lunch boxes, creating a plan of action to reduce their waste and reflecting on their results.
- Plus Plan
Statistics Word Wall Vocabulary
A comprehensive selection of statistics vocabulary for use on a Mathematics Word Wall.
- Plus Plan
Chance Word Wall Vocabulary
A comprehensive selection of chance vocabulary for use on a Mathematics Word Wall.
- Plus Plan
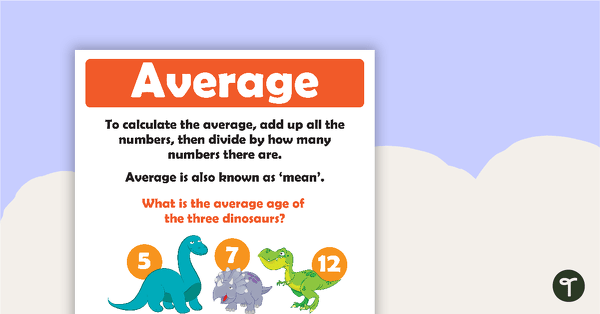
How To Calculate The Average Poster
A set of two posters which clearly show how to calculate the average of a group of numbers.
- Plus Plan
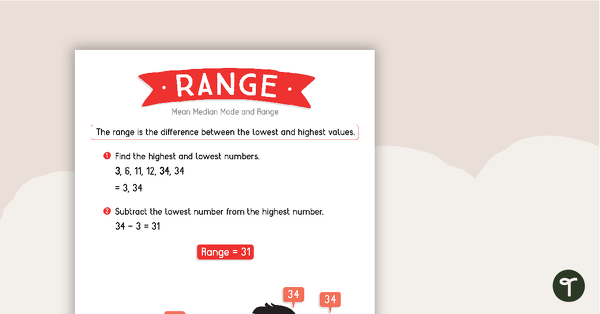
Mean, Median, Mode and Range Posters
Working with data is easy... when you can remember what each of the terms mean!
- Plus Plan
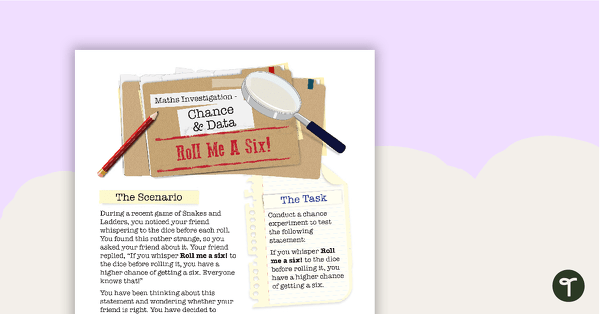
Chance and Data Maths Investigation - Roll Me a Six!
A mathematics investigation involving chance and data, embedded in a real-world context.
- Plus Plan
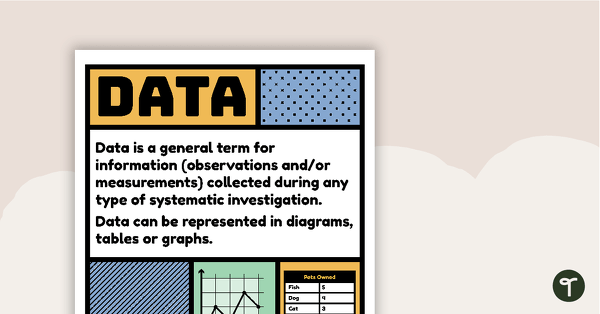
Data Vocabulary Poster
A poster that explains the concept of data and lists associated vocabulary.
- Plus Plan
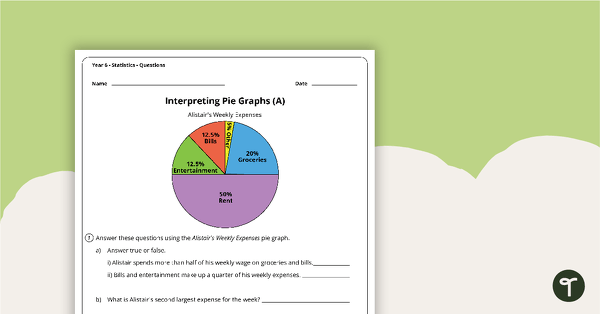
Statistics Worksheets - Year 6
6 statistics worksheets linked to the National Curriculum in England.
- Plus Plan

Data Match-Up Cards Resource Pack
A match-up activity resource pack for students to use when exploring data.