CCSS.MATH.CONTENT.6.SP.A.2
Understand that a set of data collected to answer a statistical question has a distribution which can be described by its center, spread, and overall shape.
- Plus Plan
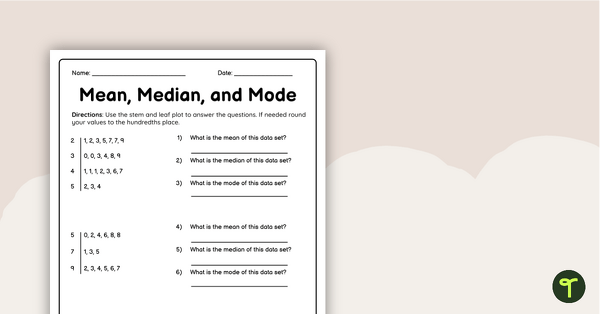
Mean Median Mode Worksheet
Use this double-sided worksheet to check students’ ability to find the mean, median and mode of given data sets.
- Plus Plan
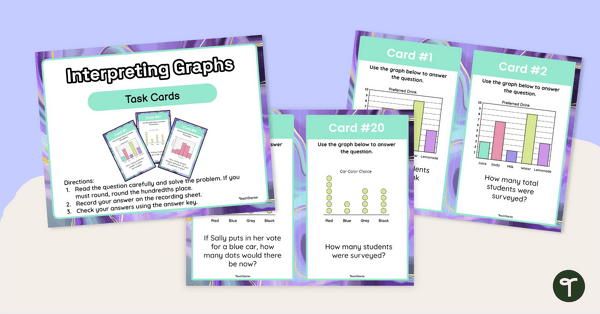
Interpreting Graphs Task Cards
Use this set of task cards students to practice interpreting bar graphs, histograms and line plots.
- Plus Plan
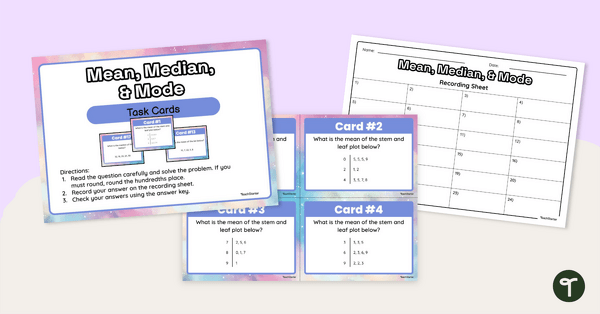
Mean Median and Mode Task Cards
Use this set of 24 data interpretation task cards to teach students to find the mean, median and mode of a limited data set.
- Plus Plan
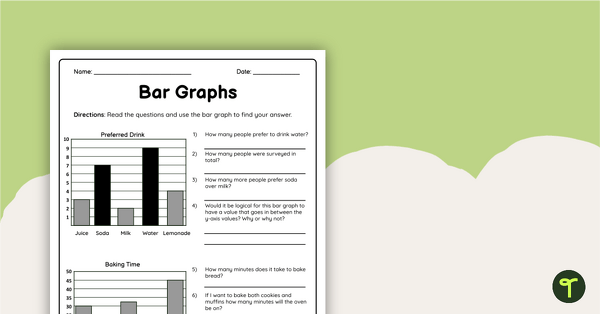
Bar Graphs Worksheet
Use this double-sided bar graphs worksheet to check your students’ understanding of interpreting and drawing bar graphs.
- Plus Plan
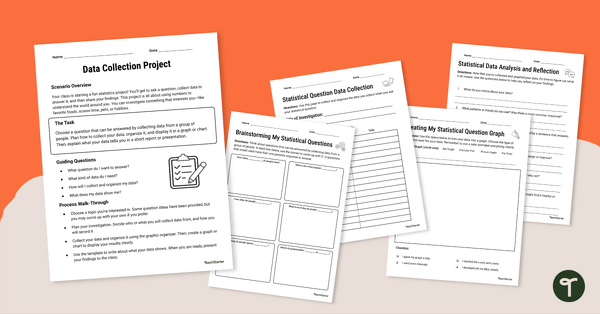
Data Collection Project
Complete this data collection project with your students to give them practice developing a statistical question, collecting data, and displaying the results.
- Plus Plan
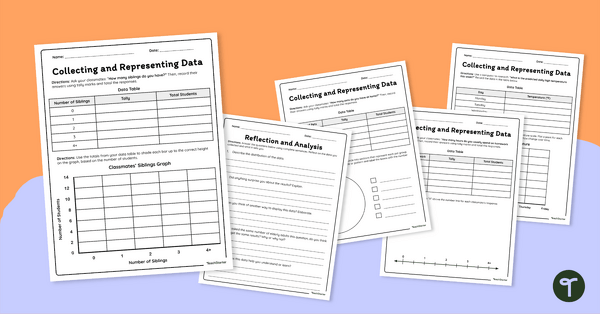
Collecting and Representing Data Worksheet Set
Download our collecting and representing data worksheet set to get your students collecting, organizing, and displaying data.
- Plus Plan
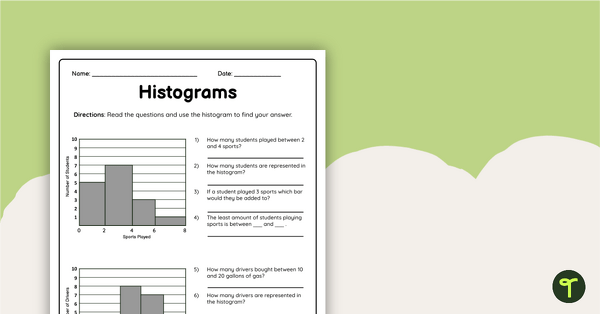
Histograms Worksheet
Encourage your students to practice reading and creating histogram graphs using this double-sided worksheet with answer key included.