Use this double-sided bar graphs worksheet to check your students’ understanding of interpreting and drawing bar graphs.
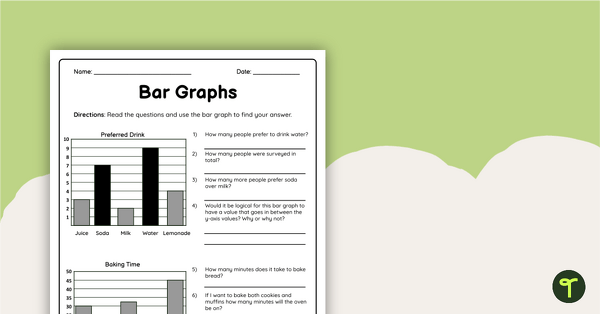
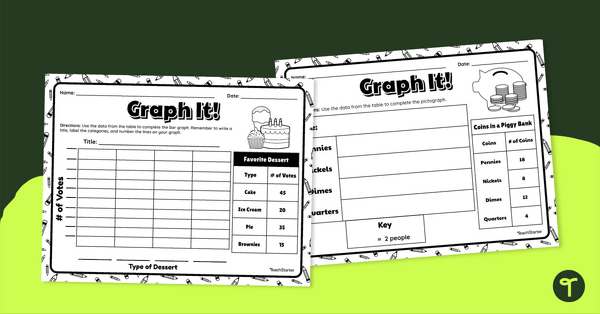
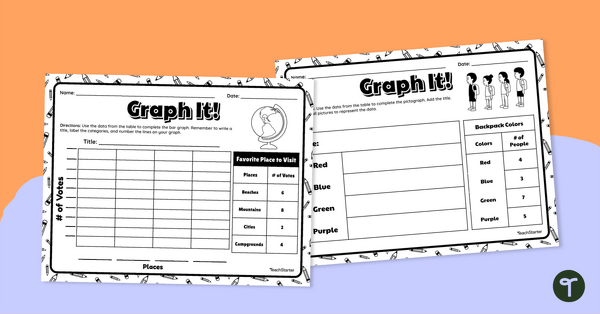
Bar Graph Worksheet — Interpret and Create Bar Graphs
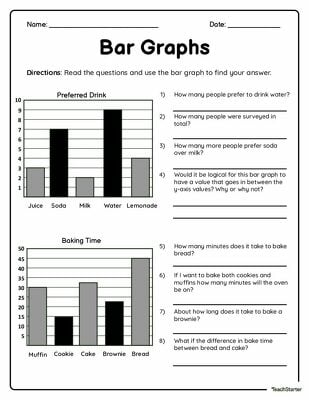
This double-sided worksheet requires Sixth Grade students to analyze and construct bar graph data displays. They will answer eight questions relating to two sample bar graphs, and create two bar graphs of their own. An answer key is provided for easy marking!
Tips for Differentiation + Scaffolding
In addition to individual student work time, use this worksheet as a:
- Math center or guided group
- lesson exit ticket
- fast finisher activity
- homework assignment
- whole-class review (via smartboard)
To make this worksheet more of a challenge for students who are waiting for others to finish, edit the worksheets in Google Slides to create more challenging graphs to that skip count on more advanced intervals.
For students who need additional support, edit the file to only include whole-number increments and alter the questions to only result in whole-number/single-interval answers.
Easily Download & Print
Use the dropdown icon on the Download button to choose between the PDF or Google Slides version of this resource.
Because this resource includes an answer sheet, we recommend you print one copy of the entire file. Then, make photocopies of the blank worksheet for students to complete.
To save paper, we suggest printing this 2-page worksheet double-sided.
Additionally, project the worksheet onto a screen and work through it as a class by having students record their answers in their notebooks.
This resource was created by Cassandra Friesen, a teacher in Colorado and Teach Starter collaborator. Don’t stop there! We’ve got more column graph and bar graph activities to reduce your lesson planning time:
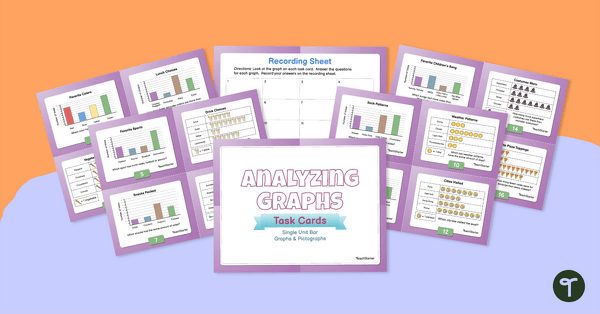
teaching resource
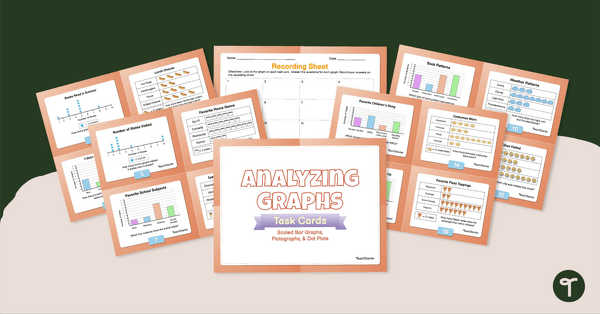
Analyzing Graphs — Scaled Bar Graphs, Pictographs, & Dot Plots —Task Cards
Use data analysis skills to analyze scaled bar graphs, pictographs, and dot plots with this set of task cards.
teaching resource
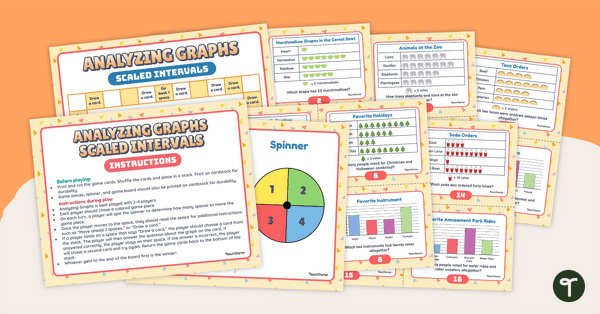
Analyzing Graphs (Scaled Intervals) – Board Game
Use this board game to sharpen data analysis skills when solving problems with information presented in a scaled picture graph and bar graph.
teaching resource
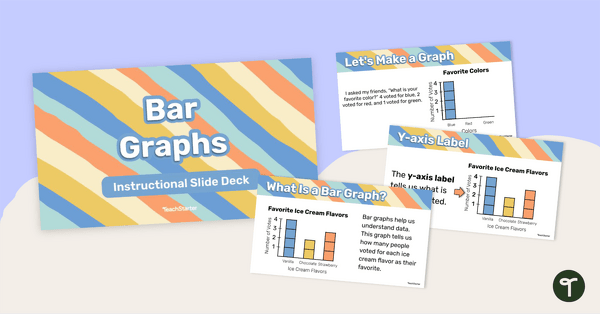
Bar Graphs – Instructional Slide Deck
Learn about the features and how to create a bar graph with this 25-page instructional slide deck.

0 Comments
Write a review to help other teachers and parents like yourself. If you'd like to request a change to this resource, or report an error, select the corresponding tab above.