Statistics and Probability
Statistics and Probability
- Plus Plan
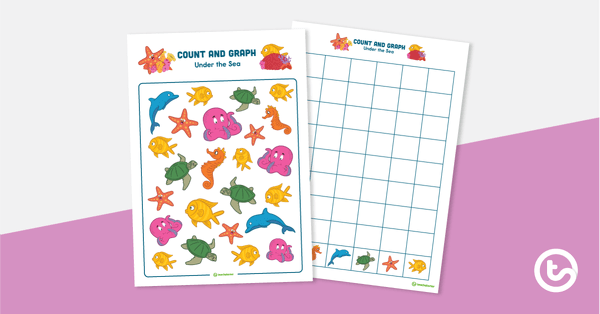
Count and Graph – Under the Sea
A sea-themed hands-on activity to introduce graphing skills.
- Plus Plan
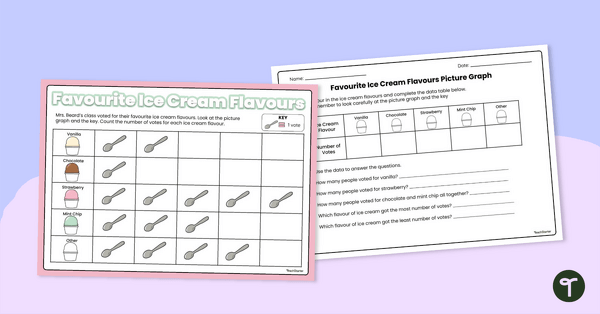
Picture Graphs Worksheet
Use this double-sided worksheet to help your students practise reading and evaluating a simple picture graph.
- Plus Plan

Autumn Maths Worksheet - Count and Graph Activity
Use an Autumn Maths Worksheet to practise counting and graphing.
- Plus Plan
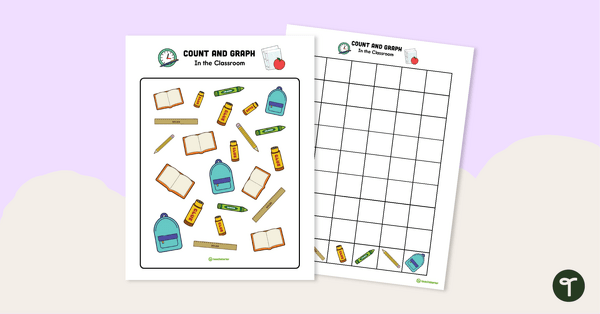
Count and Graph – In the Classroom
Practise collecting, sorting, and organising data to create a graph with this 2-page worksheet.
- Plus Plan
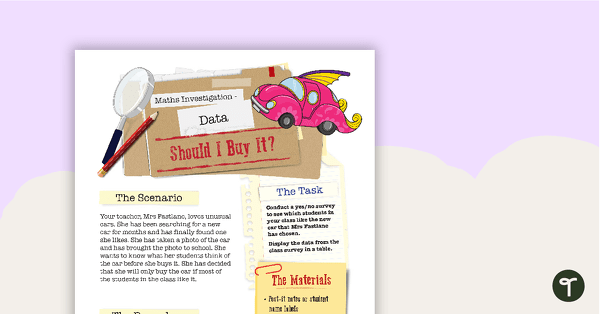
Data Maths Investigation - Should I Buy It?
A mathematics investigation involving data collection and representation, embedded in a real-world context.
- Free Plan
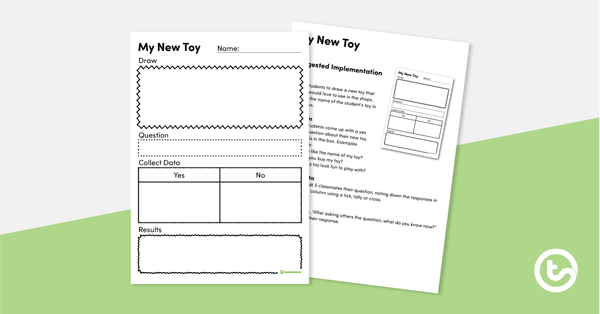
Yes or No? My New Toy – Worksheet
A task where students design a toy, pose a yes or no question and gather responses.
- Free Plan
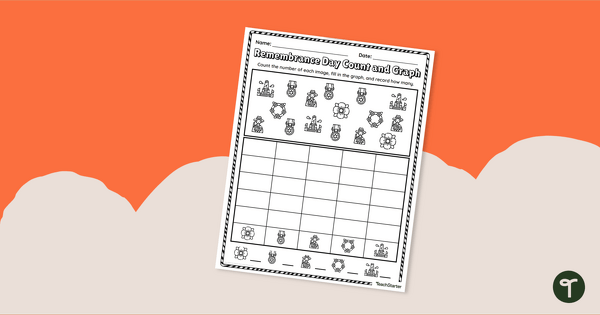
Remembrance Day Count and Graph Worksheet
Practise counting and graphing with a Remembrance Day Maths worksheet.
- Plus Plan
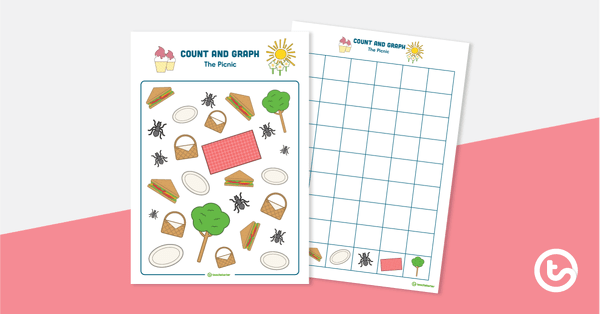
Count and Graph – The Picnic
A picnic-themed hands-on activity to introduce graphing skills.
- Plus Plan
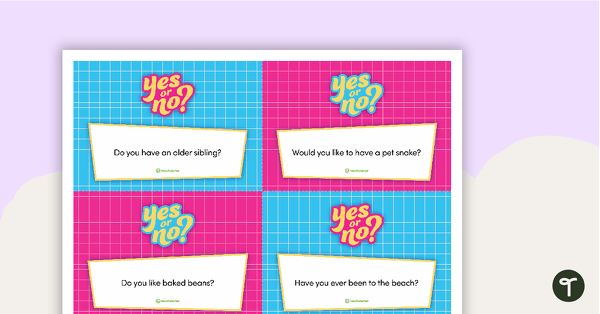
Yes or No? Questions – Flashcards
A set of 20 flashcards posing 'yes or no' questions for your students to answer.
- Plus Plan
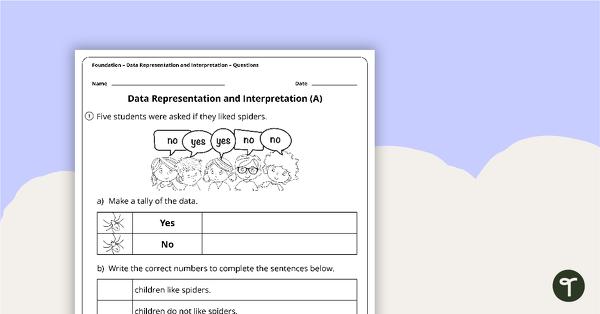
Data Representation and Interpretation Worksheets - Foundation
2 data representation and location worksheets linked to the Australian Curriculum.
- Plus Plan
Count and Graph Templates
A collection of theme-based Count and Graph templates.