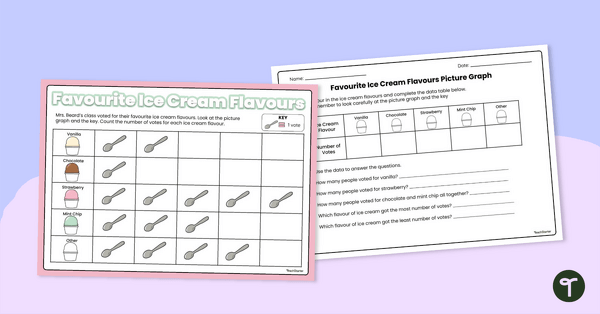
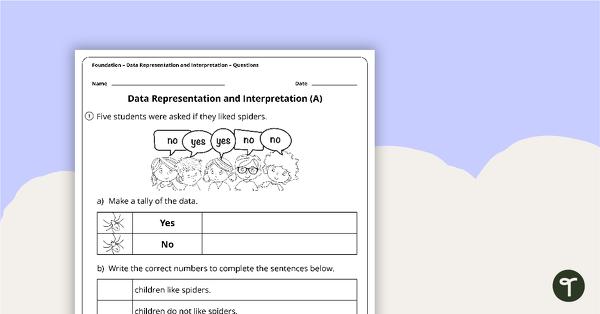
Use this double-sided worksheet to help your students practise reading and evaluating a simple picture graph.
Early Years Introduction to Picture Graphs!
Use this double-sided worksheet to show students how a pictograph (or picture graph) is an effective data display, and that they can interpret pictographs to understand data sets.
This worksheet set contains a double-sided worksheet and an answer key. The first side of the sheet contains an easy-to-read pictograph with a summer theme, and the second side contains the student tasks.
Tips for Differentiation + Scaffolding
In addition to individual student work time, use this worksheet as a:
- math rotation or guided group
- lesson exit ticket
- fast finisher activity
- homework assignment
- whole-class review (via smartboard)
For fast finishers, teachers can use the editable version in Google Slides to change the graph, or to scale the intervals (1 scoop = 3 cones).
Students who need extra support can benefit from extra teacher scaffolding to create a tangible pictograph as a group using tape and manipulative materials on the rug, and skip-count the objects to obtain the final answers.
Easily Download & Print
Use the dropdown icon on the Download button to choose between the PDF or Google Slides version of this resource.
Because this resource includes an answer sheet, we recommend you print one copy of the entire file. Then, make photocopies of the blank worksheet for students to complete.
To save paper, we suggest printing this 2-page worksheet double-sided.
Turn this teaching resource into a sustainable activity by printing on cardboard and slipping it into a write-and-wipe sleeve. Students can record their answers with a whiteboard marker, then erase and reuse.
Additionally, project the worksheet onto a screen and work through it as a class by having students record their answers in their notebooks.
This resource was created by Kendall Britnell, a teacher and Teach Starter Collaborator.
Don’t stop there! We’ve got more activities and resources that cut down on lesson planning time:
teaching resource
Picture Graph Playoff – Maths Game
A fun picture graph game for students to consolidate gathering and representing data.
teaching resource
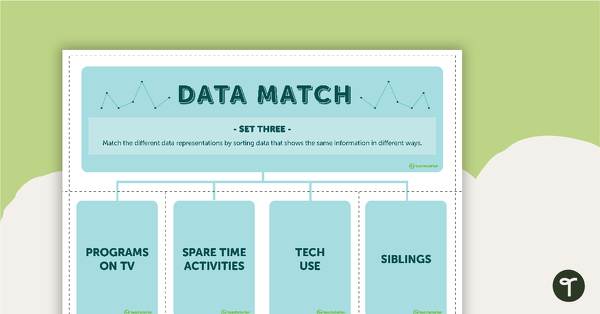
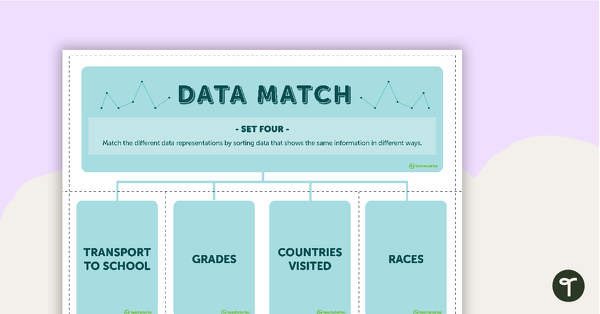
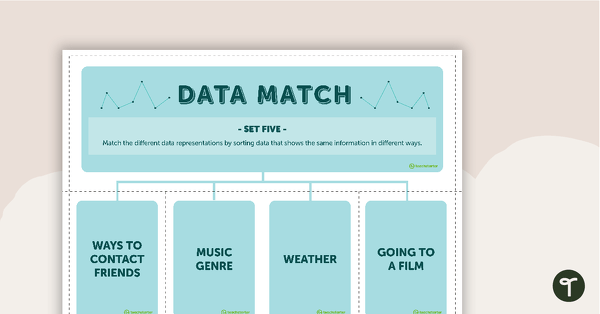
Pictograph, Bar Graph and Dot Plot Match-Up (Scaled Intervals)
Use data analysis skills to match tally charts and frequency tables with their corresponding bar graph, pictograph, or dot plot.
teaching resource
Graphing (Pictographs) Task Cards
Get graphing! Use these levelled pictograph task cards to show students a variety of data collection records, and have them create pictographs to represent that data.


0 Comments
Write a review to help other teachers and parents like yourself. If you'd like to request a change to this resource, or report an error, select the corresponding tab above.