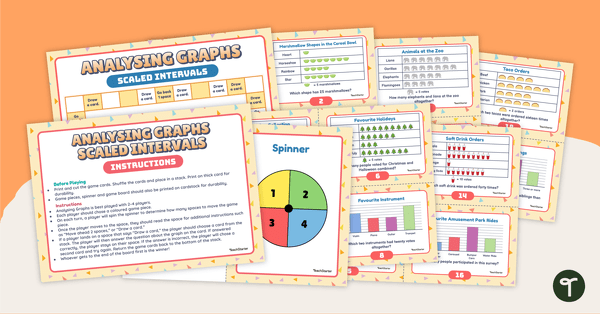
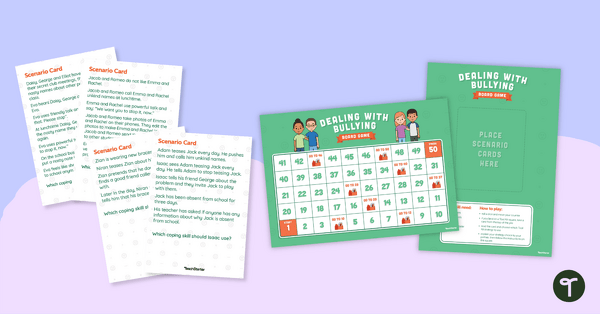
Use this board game to sharpen data analysis skills when solving problems with information presented in a scaled picture or column graph.
📊 Practise Analysing Scaled Graphs with a Board Game!
Are your students learning how to read and interpret data? Understanding the difference between different types of data displays can be tricky for young learners. With repeated practice, your students will master how to read scaled graphs in no time! With this board game, students will practise reading column graphs and pictographs scaled by 2, 5, and 10.
To play:
- On each turn, a player will spin the spinner to determine how many spaces to move the game piece.
- Once the player moves to the space, they should read it for additional instructions such as “Move ahead two spaces” or “Draw a card.”
- If a player lands on a space that says “Draw a card,” the player should choose a card from the stack. The player will then answer the question about the graph on the card. If answered correctly, the player stays on their space. The player will choose a second card and try again if the answer is incorrect. Return the game cards to the bottom of the stack.
- Whoever gets to the end of the board first is the winner!
Through this activity, students will show they can solve “how many more” and “how many less” problems using information presented in scaled bar graphs.
Tips for Differentiation + Scaffolding
A team of dedicated, experienced educators created this resource to support your maths lessons.
Use this data analysis game to enhance learning through guided maths groups, whole class lessons, or remote learning assignments.
If you have a mixture of above and below-level learners, check out these suggestions for keeping students on track with the concepts:
🆘 Support Struggling Students
Consider using the single-scale version of this board game for students who may need additional support. Additionally, students can complete this game in a 1-on-1 setting or with a small group of students with support from the teacher.
➕ Challenge Fast Finishers
If there are students who need a bit of a challenge, encourage them to create their own bar graphs and pictographs and write questions that analyse data from the graphs.
Easily Prepare This Resource for Your Students
Use the dropdown icon on the Download button to choose between the PDF or editable Google Slides version of this resource.
Print on thick card for added durability and longevity. Place all pieces in a folder or large envelope for easy access.
This resource was created by Allie Kleijnjans, a Teach Starter Collaborator.

0 Comments
Write a review to help other teachers and parents like yourself. If you'd like to request a change to this resource, or report an error, select the corresponding tab above.