Construct your own graphs with a printable set of Blank Graph Templates.
Create Your Own Graph with a Printable Blank Graph Template!
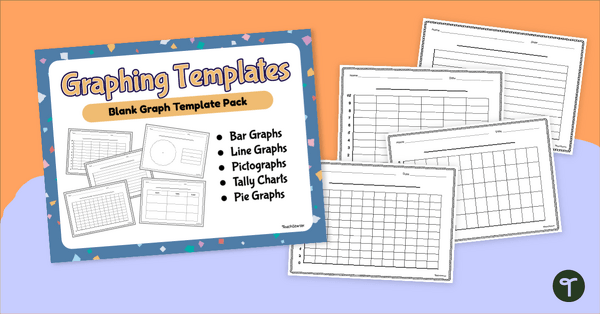
Give your classroom graphing lessons and activities a boost with this versatile set of Printable Blank Graph Templates! Perfect for students of all ages, this resource provides the templates you need to create your own graphs during lessons, projects, and science experiments. With 35 unique templates to choose from, you’ll have the right graph for every type of data collection and analysis you can find!
Which Blank Graph Templates Are Included?
This set of blank graph templates features a wide variety of graph types and scaled templates to suit any classroom need, including:
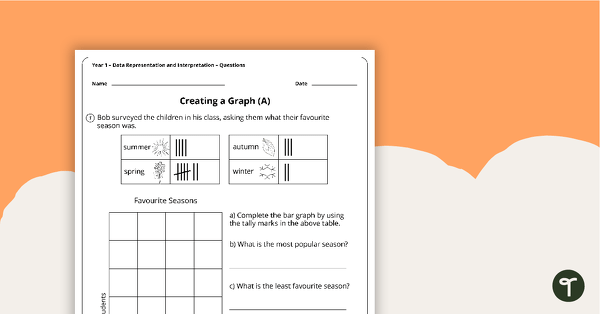
- 📊 Blank Bar Graph Templates
- 📈 Blank Line Graph Templates
- 🖼️ Blank Pictograph Templates
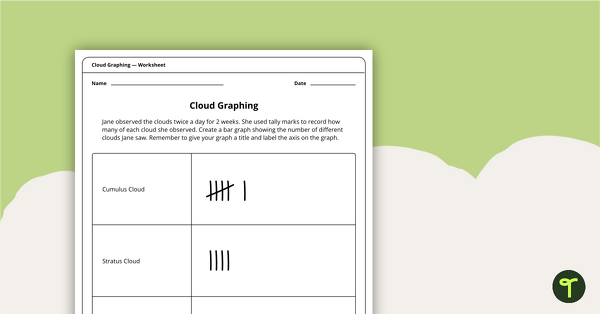
- 📏 Blank Tally Chart Templates
- 🔵 Blank Pie Graph Templates
This download includes each of the graph types above. We have also created multiple versions of each blank graph using different scale increments, the number of points on the x or y-axes, the number of choices, etc. With this download, you’re sure to find the blank graphing template to meet your classroom needs.
These printable graph templates can be used for:
- Classroom Data Collection
- Homework Assignments
- Assessments
Download Your Graphs and Charts Template Pack!
Download this set of Printable Blank Graph Templates today to provide your students with the tools they need to visualise and interpret data effectively. To get your copy, click the dropdown arrow on the download button and select the PDF or Google Slides resource file you prefer.
This resource was created by Brittany Kellogg, a teacher and Teach Starter Collaborator.
More Printable Graphing Games and Activities
Now that you’ve got the templates, it’s time to start graphing! Make sure you check out these printable graphing games and activities before you go!
[resource:5212] [resource:58465] [resource:5016369]


0 Comments
Write a review to help other teachers and parents like yourself. If you'd like to request a change to this resource, or report an error, select the corresponding tab above.