Make learning about maths as sweet as your students' favourite treats with this project based learning line plots exercise!
Creating Line Plots for a Bakery Menu
Are you ready to take your students on a culinary mathematical journey? Create something delicious together! This comprehensive line plots project is also a delectable maths adventure! This bakery-themed project is designed to ignite their creativity, engage mathematical thinking, and whisk them away into the world of baking.
Understanding Line Plots
But before we get our hands in the flour and sugar, let’s take a moment to understand what line plots are and why they are such an essential part of maths education.
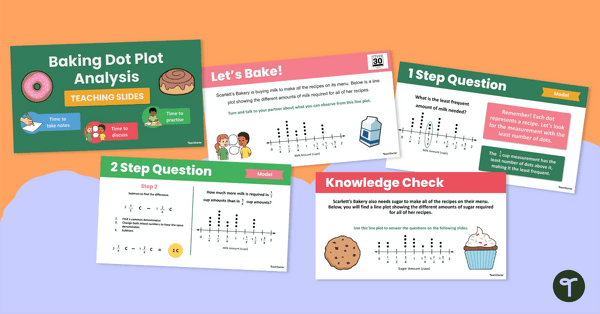
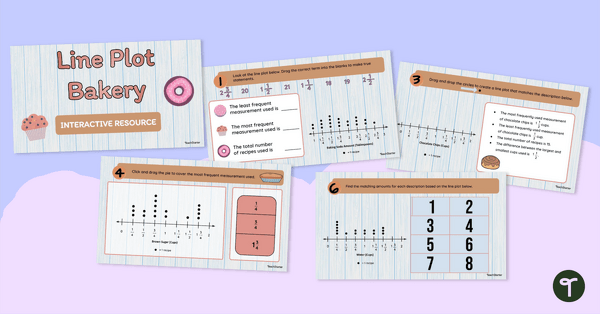
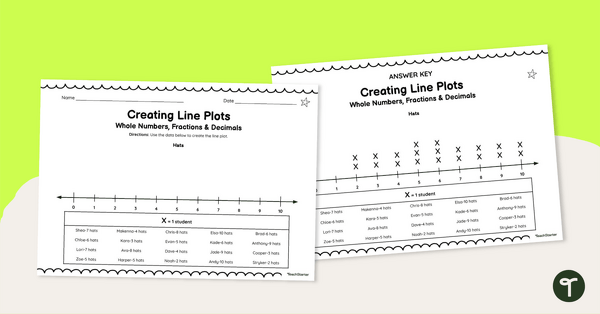
Line plots are like the secret ingredient in the recipe of data representation. They allow students to:
- Organise data in a simple and intuitive way.
- Visualise how often each value appears in a dataset.
- Discover patterns, trends, and outliers within your data.
In maths, line plots are like the foundational dough for more complex data analysis recipes. They help students think critically, collaborate with precision, and gain a deeper understanding of numbers and statistics. Plus, they are a whole lot of fun!
Line Plot Project Objective and Criteria
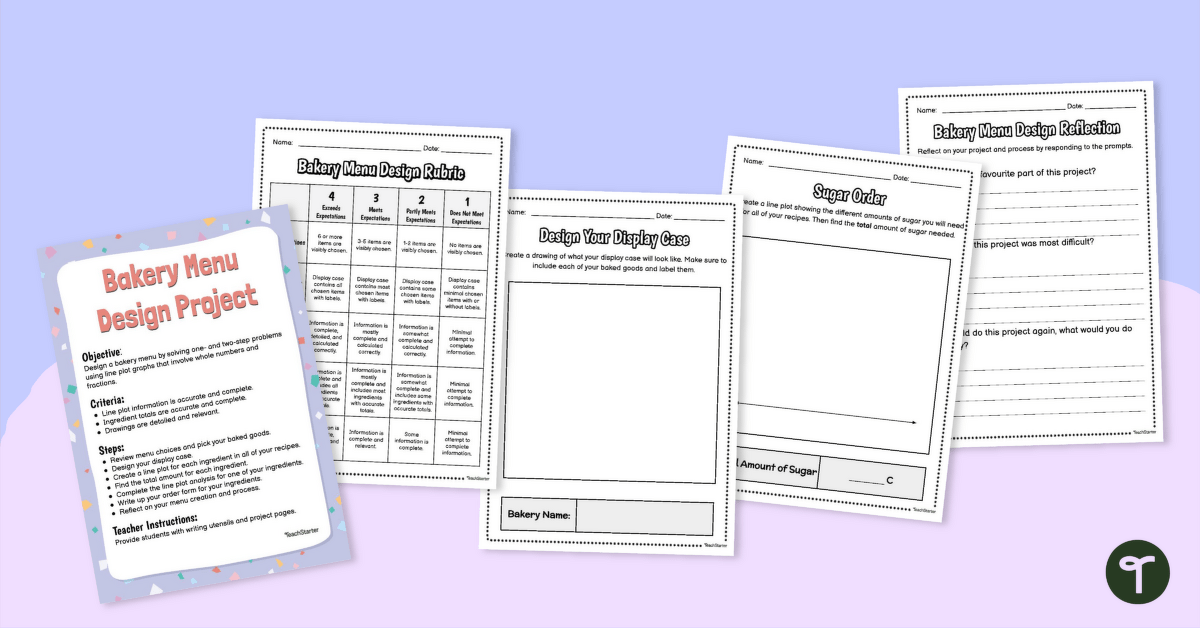
Objective: Your students’ mission is to design a bakery menu by solving one- and two-step problems using line plots. They’ll be working with whole numbers and fractions to create an enticing display of bakery delights.
Criteria for Success:
- Line plot information is accurate and complete.
- Ingredient totals should be precise and all-encompassing.
- Line plot drawings should be detailed and directly relevant to your bakery theme.
Project Steps
- Menu Choices: Students start by exploring our delightful menu choices and select your baked goods.
- Design Your Display Case: Students then design a display case that’s as visually appealing as their selected treats.
- Create Line Plots: For each ingredient in their chosen recipes, students create line plots that display the quantities of ingredients required.
- Ingredient Total: Students then calculate the total amount of each ingredient needed for their recipes.
- Line Plot Analysis: Students dive deeper into one ingredient’s line plot and provide an insightful analysis.
- Order Form: Sum up ingredient needs by creating a well-organized order form.
- Reflection: Students complete the task by reflecting on their menu creation process and the delightful journey of combining baking and maths.
This teaching resource was created by Kaylyn Chupp, a teacher and Teach Starter Collaborator.
Looking for More Graphs and Data Resources?
Make sure to check out some of our other graphing resources!
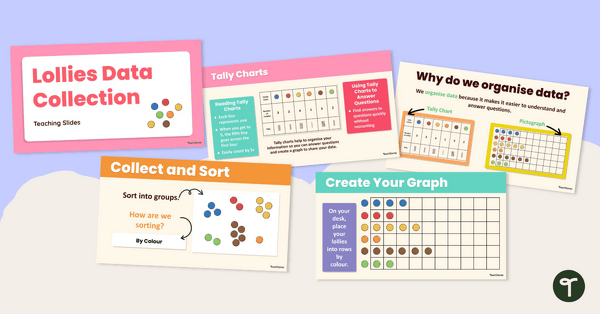
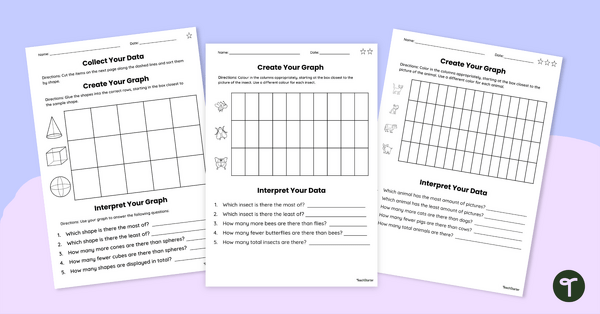
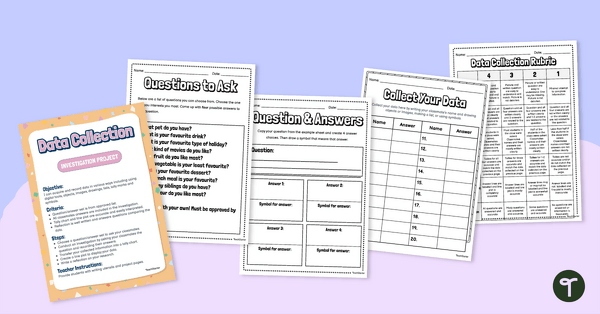
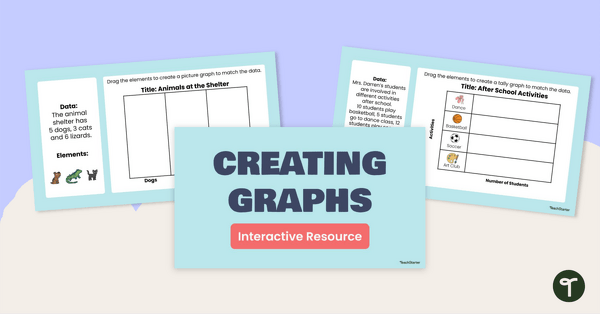
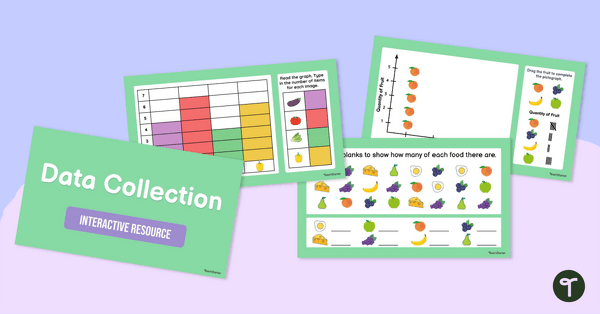
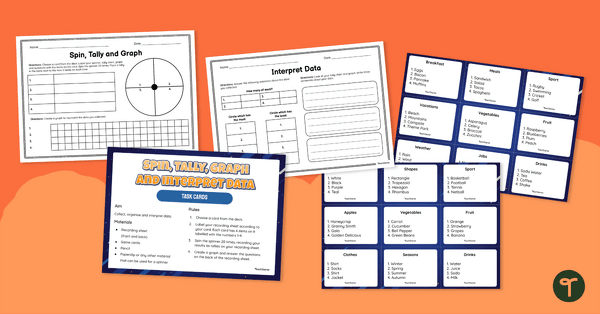
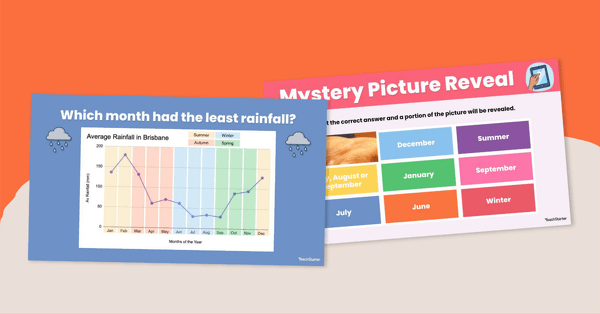
[resource:4991267] [resource:4991313] [resource:4991293]

0 Comments
Write a review to help other teachers and parents like yourself. If you'd like to request a change to this resource, or report an error, select the corresponding tab above.