
Strengthen dot plot skills with this bakery-themed interactive activity, designed to help students practise creating and analysing dot graphs in a fun, structured way.
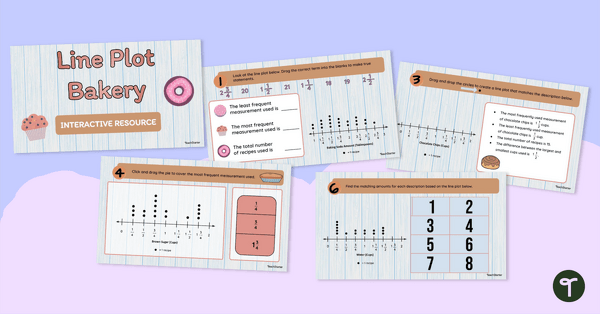
Explore Dot Graphs with This Interactive Bakery-Themed Resource
This engaging, bakery-themed interactive is designed to support students in developing confidence and competence in reading and interpreting dot plots—also known as dot graphs. Through structured practise across seven digital activities, students build essential skills in data representation while working with relatable, real-world contexts.
Each activity provides opportunities for students to:
- Analyse data visually using dot plots
- Identify the most and least frequent values
- Interpret and compare quantities
- Apply mathematical reasoning in a meaningful way
- Build dot plot graphs with the provided data
This resource clearly aligns with the Australian Curriculum for Years 2 and 3. It helps teachers deliver targeted lessons that reinforce key concepts in statistics. The drag-and-drop format encourages active participation, ideal for whole-class instruction, small group work, or independent learning.
Teachers will appreciate:
- The low-prep, high-impact nature of the resource
- Built-in scaffolding that supports a range of learners
- Opportunities for discussion, reflection, and extension
- A fun, thematic approach that keeps students engaged
Whether introducing dot plots or consolidating prior learning, this interactive offers a practical and enjoyable way to explore data with your students.
What Is a Dot Plot and How Do You Read It?
A dot plot (also called a dot graph) is a simple way to show data using dots. Each dot represents one item or value, and the dots are stacked above a number or category to show how many times it appears. Dot plots are great for showing small data sets and spotting patterns quickly.
Look at the numbers or categories along the bottom (the horizontal axis) to read a dot plot. Then, count how many dots are stacked above each one. The more dots there are, the more often that value appears in the data.
For example, the dot graph in this interactive activity shows how many tablespoons of baking soda were used in different recipes. Each dot represents one recipe. If the number “2” has five dots above it, five recipes used two tablespoons of baking soda.
Dot plots help us answer questions like:
- Which value appears the most?
- Which value appears the least?
- How many total items are shown?
How to Use This Dot Plot Interactive Activity in Your Classroom
This resource is straightforward to use, with clear and concise instructions. To complete the activities, simply follow the directions provided on each slide. You’ll need access to a smartboard or computer to fully engage with this resource, which ensures that students can take full advantage of the interactive experience.
- Individual Activity: Students can work through this resource independently, allowing them to learn at their own pace and foster a sense of responsibility for their learning.
- Group/Station Activity: This resource is perfect for station activities, promoting independent learning and hands-on experience.
- Whole Class Practise Activity: Project on your smart board and work through each slide together as a class.

This download includes digital slides that foster engagement and understanding:
- 1 Title Slide: Sets the stage for the learning journey.
- 7 Interactive Digital Slides: These interactive slides challenge and stimulate student thinking.
Dot Plot Bakery offers an interactive learning experience that engages students, provides valuable practise in dot plot analysis, and fosters critical thinking skills.
Download Your Dot Plot Interactive Activity Today
This activity is available in editable PowerPoint and Google Slides formats. To edit the text or data within the file, go to the Master Slides in PowerPoint or Theme Builder in Google Slides. Use the dropdown arrow on the Download button to choose the best format for you and your students.
This teaching resource was created by Kaylyn Chupp, a teacher and Teach Starter Collaborator.
Looking for More Graphs and Data Resources?
Make sure to check out some of our other graphing resources!
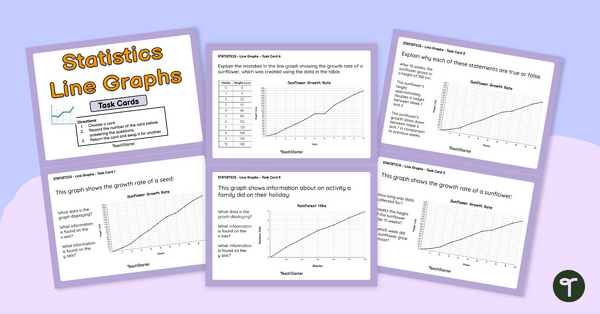
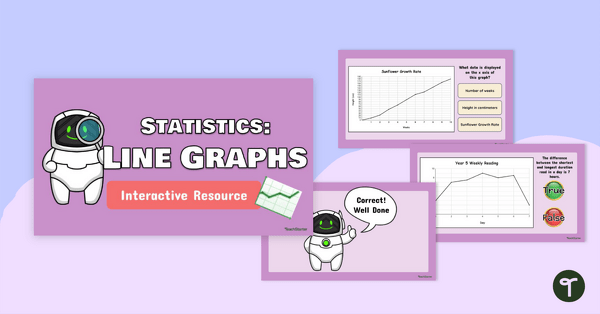
Use these task cards in your maths class to have students independently analyse and interpret line graphs. Solve the space man's line graph questions and complete the challenge with this interpreting line graphs interactive game!
teaching resource
Interpreting Line Graphs Grade 5 Worksheet Set
teaching resource
Interpreting Line Graphs Task Cards Grade 5
teaching resource
Interpreting Line Graphs Interactive Activity Grade 5


0 Comments
Write a review to help other teachers and parents like yourself. If you'd like to request a change to this resource, or report an error, select the corresponding tab above.