teaching resource

Percent Models I Have Who Has? Game

  • Updated

    Updated:  21 Jun 2023

Practise identifying percentages with visual percent models by playing an exciting 'I Have, Who Has?' game.

  • Editable

    Editable:  Google Slides

  • Non-Editable

    Non-Editable:  PDF

  • Pages

    Pages:  1 Page

  • Curriculum
  • Years

    Years:  6 - 7

Curriculum

  • VC2M5N04

    Recognise that 100% represents the complete whole and use percentages to describe, represent and compare relative size; connect familiar percentages to their decimal and fraction equivalents <ul> <li>recognising applications of percentages used in everyday contexts, for example, the bar model used for charging devices indicating the percentage of power remaining, and advertising in retail contexts relating to discounts or sales</li> <li>creating a model by subdividing a whole (for example, using 10 × 10 grids to represent various percentage amounts) and recognising complementary percentages (such as 30% and 70%) combine to make 100%</li> <li>creating a model by subdividing a collection of materials, such as blocks or money, to connect decimals and percentage equivalents of tenths and the commonly used fractions 1/2, 1/4, and 3/4; for example, connecting that one-tenth or 0.1 represents 10% and one-half or 0.5 represents 50%, and recognising that 60% of a whole is 10% more of the whole than 50%</li> <li>using physical and virtual materials to represent the relationship between decimal notation and percentages, for example, 0.3 is 3 out of every 10, which is 30 out of every 100, which is 30%</li> </ul>

  • VC2M6N05

    Solve problems involving addition and subtraction of fractions using knowledge of equivalent fractions <ul> <li>representing addition and subtraction of fractions, using an understanding of equivalent fractions and methods such as jumps on a number line, or diagrams of fractions as parts of shapes</li> <li>determining the lowest common denominator using an understanding of prime and composite numbers to find equivalent representation of fractions when solving addition and subtraction problems</li> <li>calculating the addition or subtraction of fractions in the context of real-world problems (for example, using part cups or spoons in a recipe), using the understanding of equivalent fractions</li> <li>understanding the processes for adding and subtracting fractions with related denominators and fractions as an operator, in preparation for calculating with all fractions; for example, using fraction overlays and number lines to give meaning to adding and subtracting fractions with related and unrelated denominators</li> </ul>

  • VC2M6N08

    Approximate numerical solutions to problems involving rational numbers and percentages, using appropriate estimation strategies <ul> <li>using familiar fractions, decimals and percentages to approximate calculations, such as 0.3 of 180 is about 1/3 of 180, or 52% is about 1/2</li> <li>choosing appropriate estimation strategies including rounding to the nearest whole number, knowledge of multiples of 2, 5 or 10 and partitioning numbers, in contexts such as measuring or cost per unit</li> <li>recognising the effect of rounding on calculations involving fractions or decimals and saying what numbers the answer will be between</li> <li>recognising the usefulness of estimation to check calculations for contexts such as dividing wood into a number of lengths, calculating cost per unit, reducing a recipe or dividing the cost of dinner for a group into individual amounts</li> <li>verifying solutions by estimating percentages in suitable contexts, such as discounts, using common percentages of 10%, 25%, 30%, 50% and 1%</li> <li>investigating estimation strategies to make decisions about steam cooking in ground ovens by Aboriginal and/or Torres Strait Islander Peoples, including catering for different numbers of people and resources needed for cooking</li> </ul>

teaching resource

Percent Models I Have Who Has? Game

  • Updated

    Updated:  21 Jun 2023

Practise identifying percentages with visual percent models by playing an exciting 'I Have, Who Has?' game.

  • Editable

    Editable:  Google Slides

  • Non-Editable

    Non-Editable:  PDF

  • Pages

    Pages:  1 Page

  • Curriculum
  • Years

    Years:  6 - 7

Practise identifying percentages with visual percent models by playing an exciting 'I Have, Who Has?' game.

👀 Looking for Percent Games?

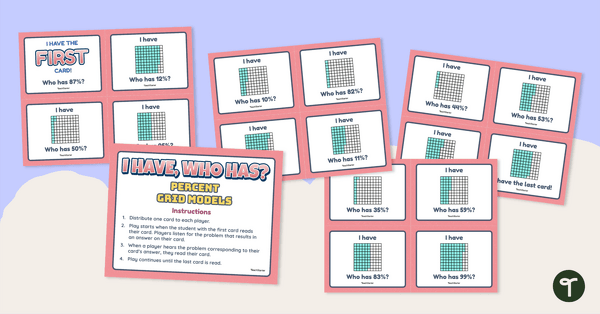
Are you looking for a fun way to engage your entire class as you begin your percentages unit? When first introducing this concept, many teachers like to represent percentages in a form familiar to students: a 10×10 grid. With this visual model, students can determine how many squares are shaded to represent the percent of the square. 

Teach Starter has created a fun “I Have, Who Has?” game where all your students can participate and learn simultaneously! This download includes 32 game cards. If you have cards left over after distributing them to your students, assign a few students to have 2 cards.

To play:

  1. Distribute one card to each player.
  2. Play begins when the student with the first card reads their card. Players listen for the problem that results in an answer on their cards.
  3. When a player hears the problem corresponding to their card’s answer, they read their card.
  4. Play continues until the last card is read.

Through this activity, students will show they can determine a percentage from a 10 x 10 grid model.

Tips for Differentiation + Scaffolding 

A team of dedicated, experienced educators created this resource to support your math lessons. 

If you have a mixture of above and below-level learners, check out these suggestions for keeping students on track with the concepts: 

🆘 Support Struggling Students

Help students who need help understanding the concepts by demonstrating how the game works in a small group. Select a few students to sit in the front of the room and show them how to play the game. Students can observe how students determine the percentage on their card and wait to hear the question that corresponds with their answer.

➕ Challenge Fast Finishers

If there are students who need an added challenge, encourage them to write their percentage as both a fraction and a decimal.

Easily Prepare This Resource for Your Students

Use the dropdown icon on the Download button to choose between the colour PDF, black and white PDF, or editable Google Slides version of this resource. 

Print on cardboard for added durability and longevity. Place all pieces in a folder or large envelope for easy access. 


This resource was created by Cassandra Friesen, a Teach Starter Collaborator. 

0 Comments

Write a review to help other teachers and parents like yourself. If you'd like to request a change to this resource, or report an error, select the corresponding tab above.

Log in to comment

You may also like