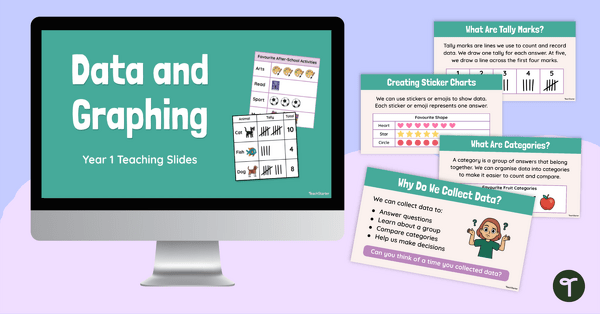
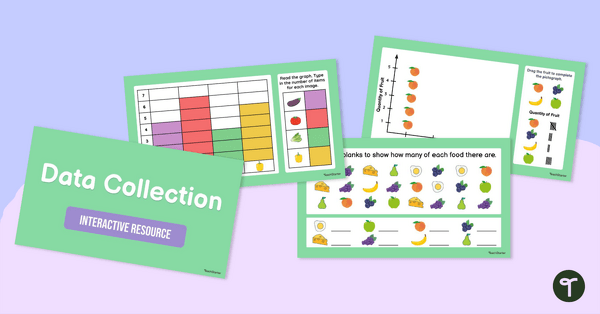
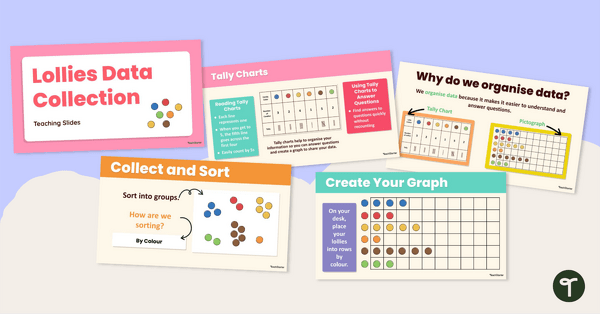
Introduce students to data and graphing with this engaging teaching slide deck, designed to help Year 1 students collect, organise, display and interpret data through hands-on investigations and classroom discussions.
Data and Graphing Teaching Slides for Year 1
Help students develop a strong understanding of data and graphing as they learn how to ask questions, collect information and organise results. Through interactive examples and guided discussions, students explore key concepts such as categories, tally marks, tally charts and pictographs.
Students will learn how to collect and record data, organise information into categories, create simple data displays and compare results using mathematical language such as most, least and equal. They will also investigate how data can be used to answer questions and make decisions in everyday situations.
Data and Graphing Activities for Whole-Class Learning
These teaching slides are ideal for:
- Class Discussions – Explore why we collect data and how data helps us answer questions and make decisions.
- Guided Data Investigations – Model surveys, tally charts and pictographs while collecting and analysing data as a class.
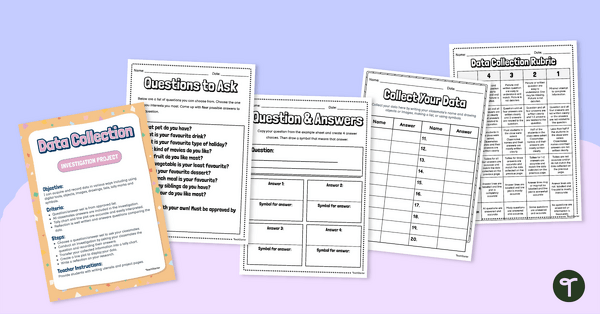
- Student Data Projects – Support students as they plan, collect and interpret their own data investigations.
The gradual, step-by-step approach helps students build confidence while developing important data literacy and mathematical reasoning skills.
Download These Data and Graphing Teaching Slides
This resource is available as an editable PowerPoint presentation and an editable Google Slides version. Use the Download button to access your preferred format. Please note that you will be prompted to make your own copy of the Google Slides file before editing.
This resource was created by Lindsey Phillips, a teacher and a TeachStarter collaborator.
More Data and Graphing Resources
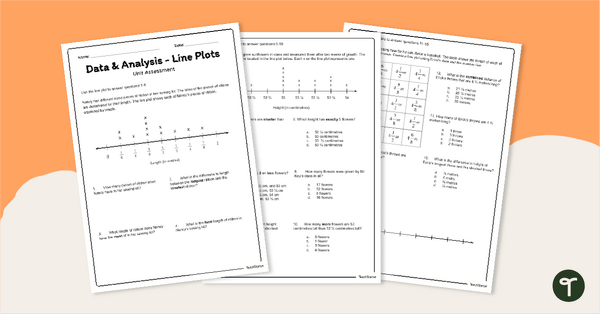
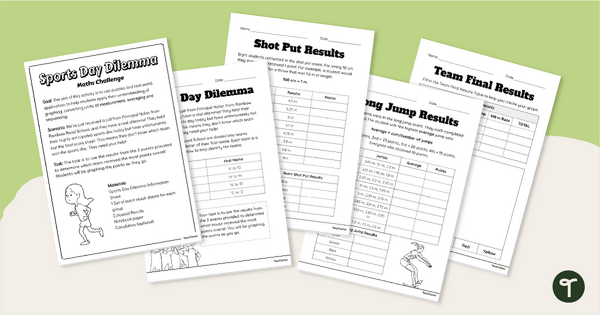
Discover more resources designed to help students collect, organise, represent and interpret data with confidence.
[resource:5222506] [resource:5222521] [resource:4854]

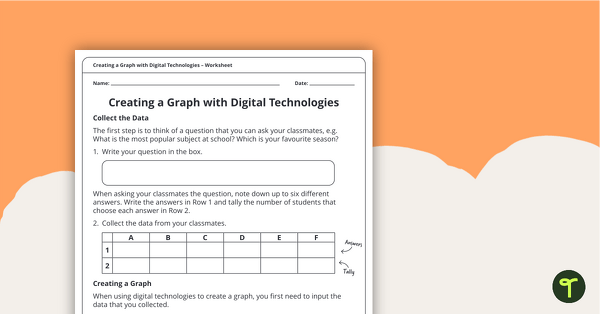
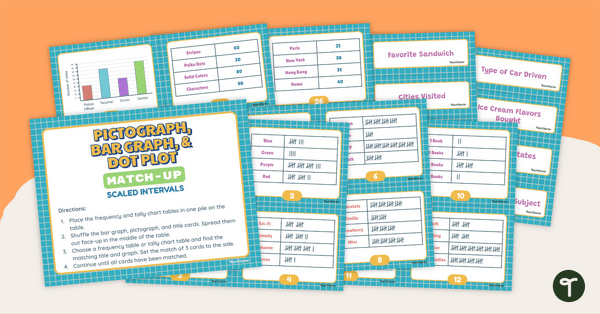
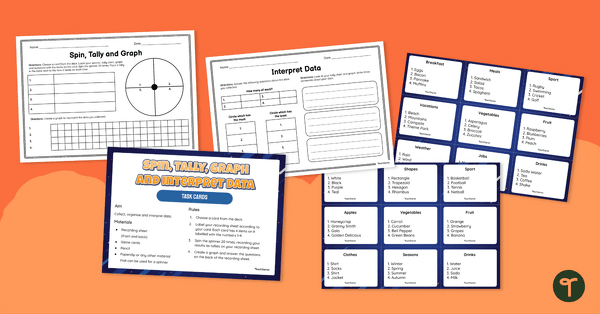
0 Comments
Write a review to help other teachers and parents like yourself. If you'd like to request a change to this resource, or report an error, select the corresponding tab above.