Victorian Curriculum
Statistics and Probability
Describe probabilities using fractions, decimals and percentages
Show more
4
teaching resources for those 'aha' moments
- Free Plan
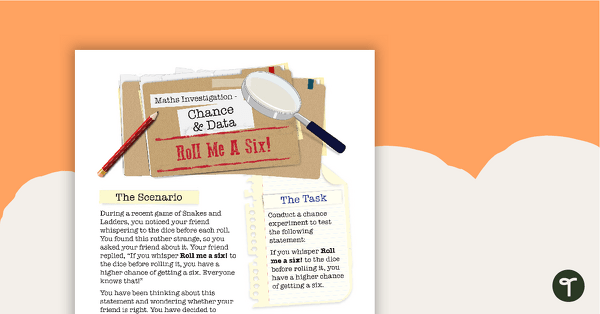
Chance and Data Maths Investigation - Roll Me a Six!
A mathematics investigation involving chance and data, embedded in a real-world context.
- Plus Plan
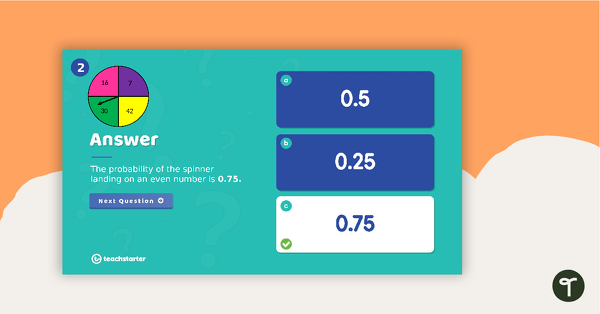
Chance and Probability Upper Years PowerPoint
An engaging 30 slide interactive PowerPoint to use in the classroom when learning about chance and probability in the upper years.
- Plus Plan
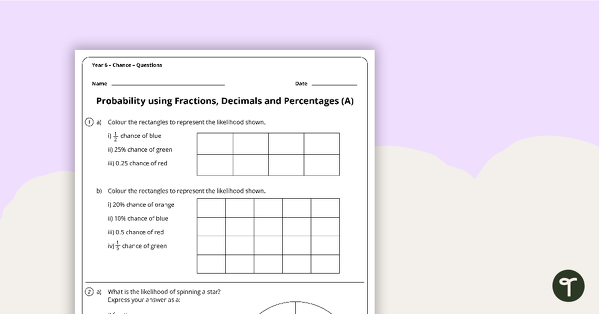
Chance Worksheets - Year 6
4 chance worksheets linked to the Australian Curriculum.
- Plus Plan

Data Representation and Interpretation Worksheets - Year 6
8 data representation and interpretation worksheets linked to the Australian Curriculum.