teaching resource

Chance and Data Maths Investigation - Roll Me a Six!

  • Updated

    Updated:  22 May 2023

A mathematics investigation involving chance and data, embedded in a real-world context.

  • Non-Editable

    Non-Editable:  PDF

  • Pages

    Pages:  9 Pages

  • Curriculum
  • Years

    Years:  5 - 6

Curriculum

  • VC2M5ST01

    Acquire, validate and represent data for nominal and ordinal categorical and discrete numerical variables to address a question of interest or purpose using software including spreadsheets; discuss and report on data distributions in terms of highest frequency (mode) and shape, in the context of the data <ul> <li>recognising that ordinal data is a form of categorical data even though the data being collected might be numbers, for example, a rating scale using numbers 1–5 to represent the categories people can choose from when asked, ‘What rating would you give this film out of 5?’</li> <li>determining the mode for a set of data and discussing that there may be more than one mode</li> <li>identifying the best methods of presenting data to illustrate the results of investigations and justifying the choice of representations</li> <li>acquiring data through chance experiments, discussing and reporting on the distribution of outcomes and how this relates to equal and unequal outcomes</li> <li>using digital systems to validate data; for example, recognising the difference between numerical, text and date formats in spreadsheets, and setting data types in a spreadsheet to make sure a date is input correctly</li> <li>investigating data relating to the reconciliation process between Aboriginal and Torres Strait Islander Peoples and non-Indigenous Australians, posing questions, discussing and reporting on findings</li> </ul>

  • VC2M5ST03

    Plan and conduct statistical investigations by posing questions or identifying a problem and collecting relevant data; choose appropriate displays and interpret the data; communicate findings within the context of the investigation <ul> <li>posing questions about insect diversity in the playground, and collecting data by taping a one-metre-square piece of paper to the playground and observing the type and number of insects on it over time</li> <li>posing a question or identifying a problem of interest; collecting, interpreting and analysing the data; and discussing if the data generated provides the information necessary to answer the question</li> <li>developing survey questions that are objective, without opinion, and have a balanced set of answer choices without bias</li> <li>exploring Aboriginal and/or Torres Strait Islander ranger groups’ and other groups’ biodiversity detection techniques to care for Country/Place, posing investigative questions, and collecting and interpreting related data to represent and communicate findings</li> </ul>

  • VC2M6ST01

    Interpret and compare data sets for ordinal and nominal categorical, discrete and continuous numerical variables using comparative displays or visualisations and digital tools; compare distributions in terms of mode, range and shape <ul> <li>determining the range for a numerical data set by finding the difference between the highest and the lowest value in the set and comparing the range for different data sets</li> <li>representing acquired numerical data sets using side-by-side column graphs, comparing the spread of each data set using the range, the highest frequency for each data set using the mode, and discussing the shape</li> <li>representing ordinal data collected through surveys, using visualisation tools including dot plots and bar charts, and discussing the distribution of data in terms of shape</li> <li>using technology to access data sets and graphing software to construct side-by-side column graphs or stacked line graphs; and comparing data sets that are grouped by gender, year level, age group or other variables, and discussing findings</li> </ul>

  • VC2M6P01

    Describe probabilities using fractions, decimals and percentages; recognise that probabilities lie on numerical scales of 0–‍1 or 0%–100%; use estimation to assign probabilities that events occur in a given context, using common fractions, percentages and decimals <ul> <li>recognising that the probability of an event occurring can be represented numerically as either a number ranging from zero to one or a percentage from 0% to 100% where zero or 0% means it will not happen and one or 100% means it is certain to happen</li> <li>using a scale of zero to one or 0% to 100% to estimate chances of events</li> <li>listing the different possible outcomes for rolling a dice and using a scale to locate the relative probability by considering the chance of more than or less than for each possible event, for example, the probability of getting a number greater than 4</li> <li>recognising the language used to describe situations involving uncertainty, such as what it means to be ‘lucky’, a ‘75% chance’ of rain or a ‘1-in-100 years’ flood</li> <li>exploring Aboriginal and/or Torres Strait Islander children’s instructive games, such as Weme from the Warlpiri Peoples of Central Australia, to investigate and assign probabilities that events will occur, indicating their estimated likelihood</li> </ul>

  • VC2M6P02

    Conduct repeated chance experiments and run simulations with an increasing number of trials using digital tools; compare observations with expected results and discuss the effect on variation of increasing the number of trials <ul> <li>using digital tools to simulate multiple tosses of a coin or dice and comparing the relative frequency of an outcome as the number of trials increases; and identifying the variation between trials and realising that the results tend to the prediction with larger numbers of trials</li> <li>using online simulations of repeated random events to recognise emerging patterns, discussing and comparing expected results to the actual results</li> <li>investigating the relative frequencies of all outcomes for a chance experiment and verifying that their sum equals one</li> <li>systematically recording the outcome of large numbers of spins on a spinner and analysing the relative frequencies of outcomes, representing these as percentages</li> </ul>

teaching resource

Chance and Data Maths Investigation - Roll Me a Six!

  • Updated

    Updated:  22 May 2023

A mathematics investigation involving chance and data, embedded in a real-world context.

  • Non-Editable

    Non-Editable:  PDF

  • Pages

    Pages:  9 Pages

  • Curriculum
  • Years

    Years:  5 - 6

A mathematics investigation involving chance and data, embedded in a real-world context.

This open-ended mathematics investigation has been designed to deepen students’ understanding of chance, data collection and data representation.

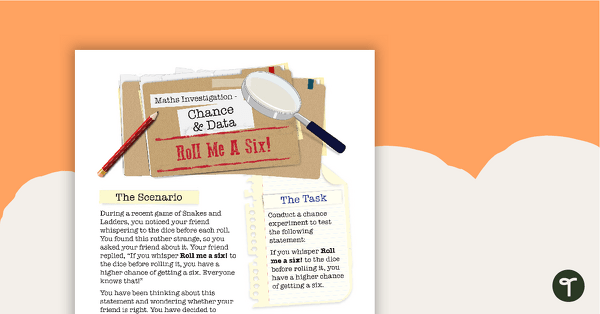
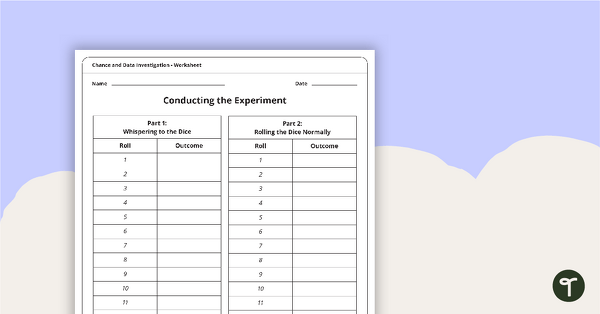
In this investigation, the students must conduct a comprehensive chance experiment to test the following statement:

If you whisper Roll me a six! to a dice before rolling it, you have a higher chance of getting a six.

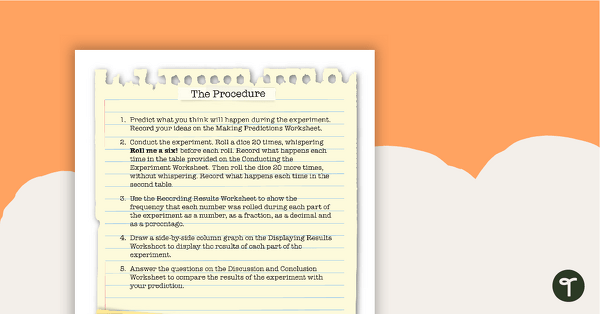
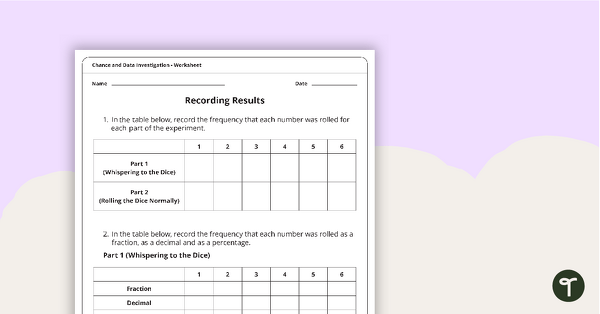
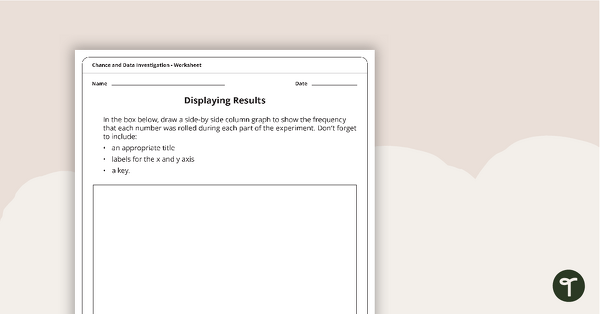
The students must collect data by rolling a dice 20 times, whispering Roll me a six! before each roll. They must then roll the dice 20 more times without whispering. The students must present and compare their data using frequency tables and a side-by-side column graph.

This teaching resource includes:

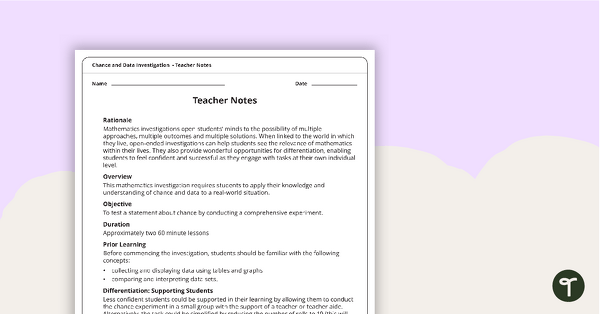
  • teacher notes, detailing a range of important information about the investigation
  • a detailed description of the investigation for students, including step-by-step instructions
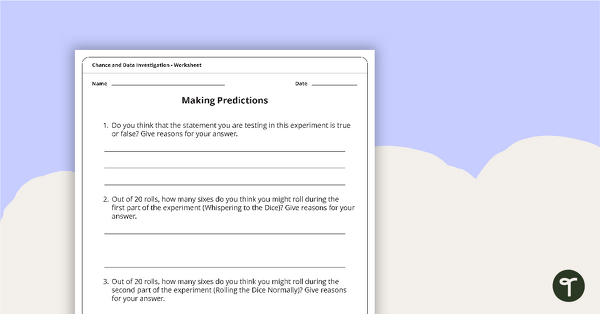
  • various recording worksheets
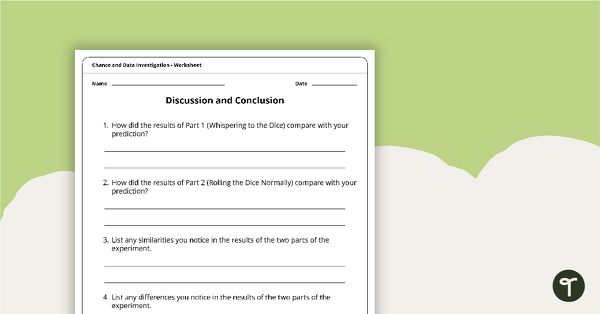
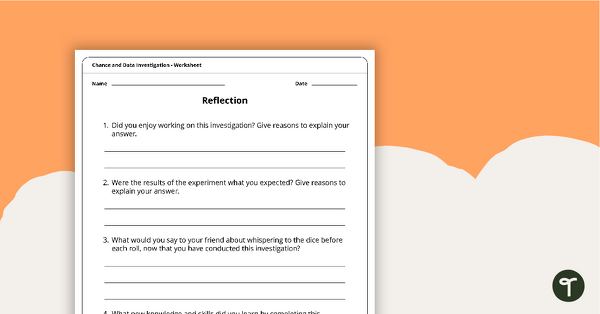
  • reflection questions.

1 Comment

Write a review to help other teachers and parents like yourself. If you'd like to request a change to this resource, or report an error, select the corresponding tab above.

Log in to comment

No comments yet.

You may also like