Summarize and describe distributions
- Plus Plan
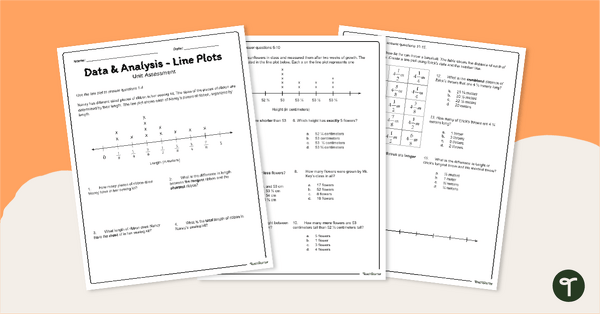
Dot Plots / Line Plots - 4th & 5th Grade Assessment
Assess student understanding of reading and creating line plots with a printable math test for 5th grade.
- Plus Plan
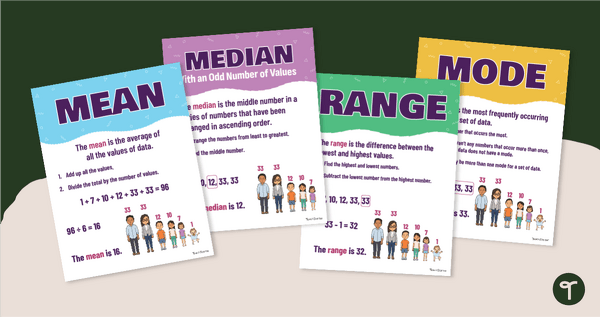
Range, Mean, Median & Mode Chart Pack
Download a Range, Mean, Median & Mode Chart pack to help your students remember measures of central tendency.
- Plus Plan
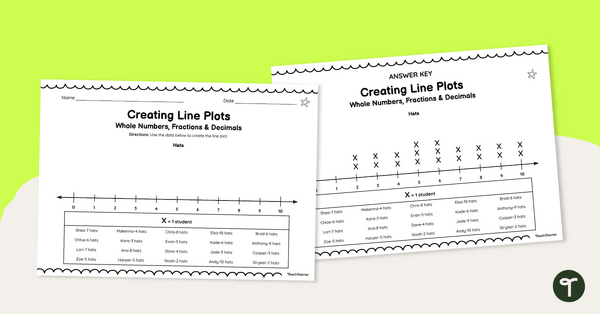
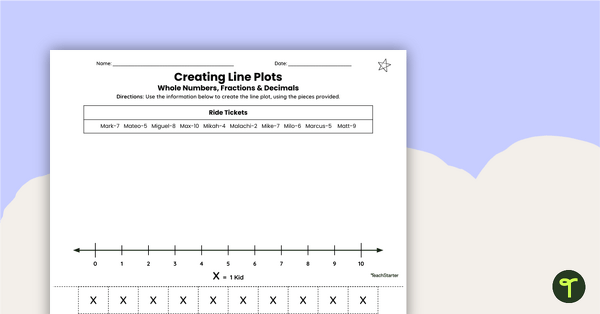
Creating Line Plots (With Whole Numbers, Fractions and Decimals) Worksheets
Help your students master data representation with this series of leveled worksheets for creating line plots.
- Plus Plan
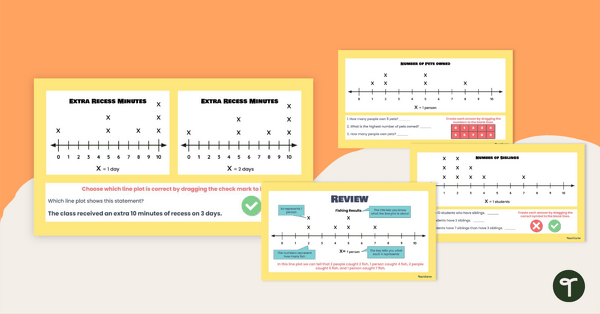
Analyzing Line Plots Interactive Activity
Dive into data with your class using this engaging Analyzing Line Plots Interactive Activity!
- Plus Plan
Creating Line Plots (with Fractions and Decimals) Small Group Activity
Incorporate this small group activity into your math centers to reinforce students skills in interpreting data and displaying it as line plots.
- Plus Plan
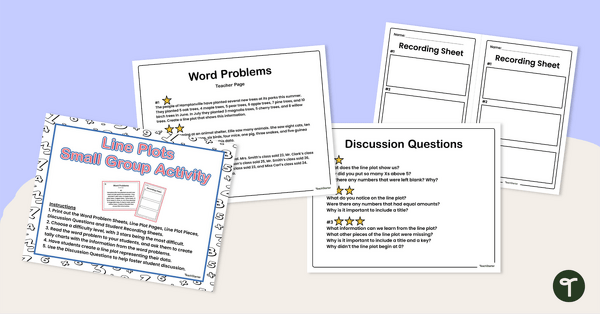
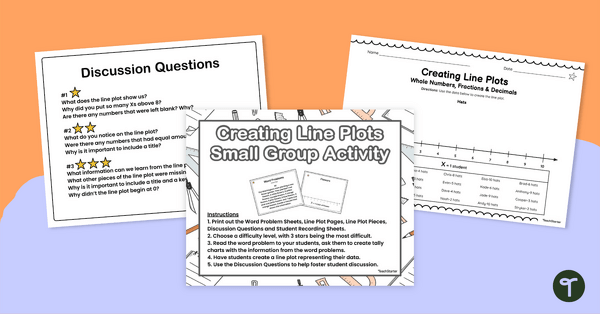
Creating Line Plots Small Group Activity
Enhance your students’ math skills through this small group activity where they’ll transfer word based data to create line plots.
- Plus Plan
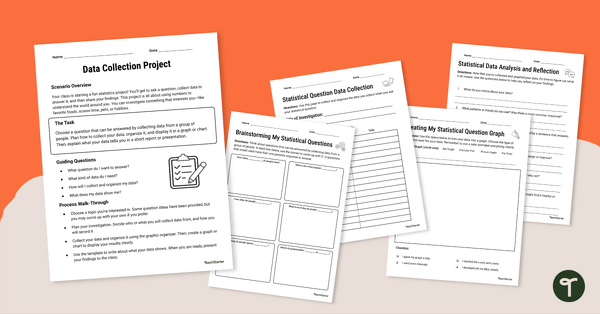
Data Collection Project
Complete this data collection project with your students to give them practice developing a statistical question, collecting data, and displaying the results.
- Plus Plan
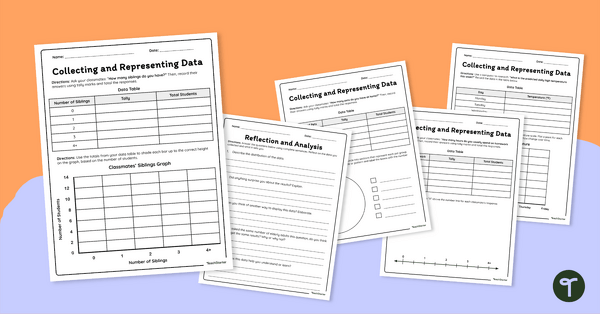
Collecting and Representing Data Worksheet Set
Download our collecting and representing data worksheet set to get your students collecting, organizing, and displaying data.
- Plus Plan
Creating Line Plots (Fractions and Decimals) Cut and Paste Worksheets
Enable your students to create line plots to represent given data, using this hands-on cut and paste worksheet set.
- Plus Plan

Frida's Fiesta Stimulus – Task Cards
39 activity task cards based on the Frida's Fiesta Restaurant menu which is included.
- Plus Plan
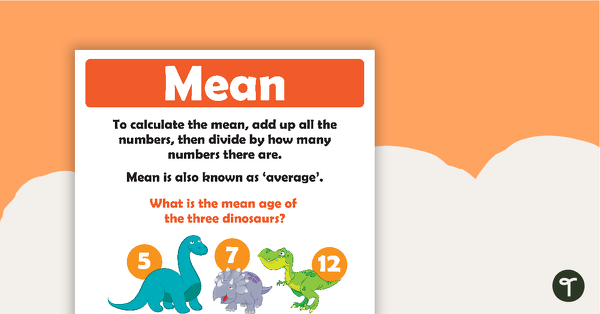
How To Calculate The Mean - Poster
A set of two posters which clearly show how to calculate the average of a group of numbers.