Incorporate this small group activity into your math centers to reinforce students skills in interpreting data and displaying it as line plots.
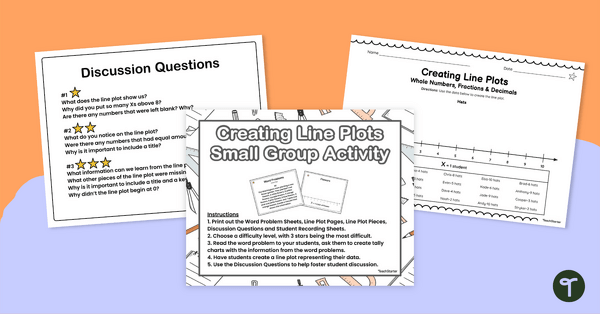
Exploring Data with Line Plots: A Small Group Activity
This small group activity is designed to empower students to work together, tackle word problems, and create line plots with precision and clarity. The primary purpose of our “Creating Line Plots with Whole Numbers, Fractions, and Decimals” resource is to engage students in a small group setting, where they work together to decipher information from word problems and transform it into line plots. This hands-on activity fosters both teamwork and data analysis skills.
Understanding Line Plots
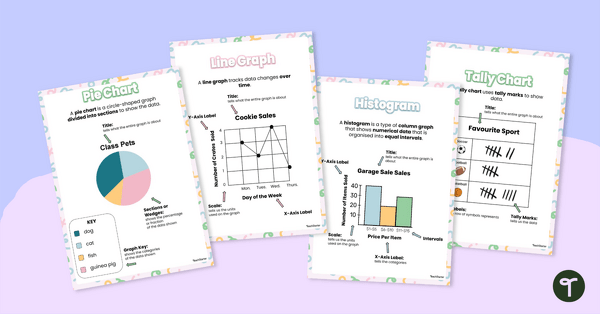
Before delving into this resource, let’s briefly explore what line plots are and why they are taught in elementary math education. Line plots are a visual representation of data that provide students with a clear way to:
- Organize and display data in a simple and intuitive manner.
- Identify the frequency of specific values within a dataset.
- Analyze data trends, outliers, and patterns.
In elementary math education, line plots are an essential tool that lays the foundation for more complex data analysis in the future. They encourage students to think critically, work collaboratively, and make sense of data, skills that are valuable throughout their academic journey and beyond.
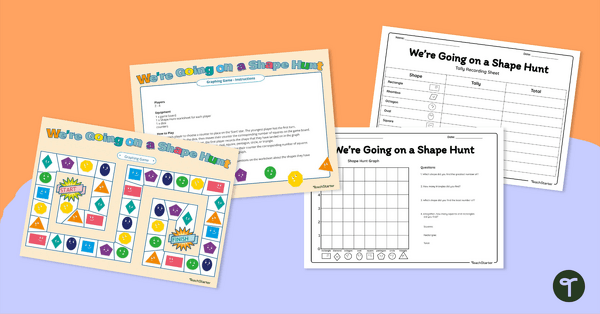
What’s Included in This Resource Download:
Our resource is packed with everything you need for a productive small group session, including:
- Set of Directions: Clear and comprehensive instructions for teachers, ensuring smooth implementation.
- 3 Leveled Word Problems: Word problems designed to cater to various proficiency levels, promoting inclusivity.
- Discussion Questions: Thought-provoking questions to stimulate student discussions, critical thinking, and analysis.
- Line Plot Pieces: Visual aids to create line plots, making data representation tangible and engaging.
- Student Recording Sheet: A handy tool for students to record their data and thoughts as they work through the problems.
- Answer Keys: To simplify grading and offer a clear reference point for both teachers and students.
Using This Resource for Teaching About Line Plots
Make the most of this resource by following these steps:
- Print All Materials: Ensure you have hard copies of Word Problem Sheets, Line Plot Pages, Line Plot Pieces, Discussion Questions, and Student Recording Sheets.
- Choose Difficulty Level: Tailor the activity to your students’ proficiency by selecting a difficulty level, with 3 stars indicating the most challenging.
- Reading and Creating: Read the word problem to your students, and ask them to create tally charts with the information provided. Then, guide them in creating line plots representing the data.
- Foster Discussion: Use the Discussion Questions to facilitate discussion among students, encouraging them to analyze the line plots and draw conclusions.
Our “Creating Line Plots with Whole Numbers, Fractions, and Decimals” resource offers multiple ways to incorporate it into your classroom:
- Guided Group Activity: It is designed for small groups, fostering collaboration, teamwork, and peer support.
- Center/Station Activity: This resource can be used within center or station rotations to enhance independent learning and offer hands-on experience.
Differentiation Strategies
We understand that students have diverse needs and abilities. Our resource provides strategies for differentiation:
- Challenge for Advanced Students: Assign advanced students the more challenging level worksheet and engage them with questions that stimulate deeper analysis of the line plots.
- Support for Struggling Students: For students who may find the concept challenging, the less challenging level worksheet is an appropriate choice. You can also offer guidance to help them complete their recording sheets, fostering a scaffolded approach to learning.
This graphs and data resource is your key to a dynamic and collaborative math learning experience. With this resource, students can gain confidence in working with data and develop critical thinking skills that will serve them well in their mathematical journey.
This teaching resource was created by Brittany Kellogg, a teacher in Ohio and a Teach Starter Collaborator.
Looking for More Graphs and Data Resources?
Make sure to check out some of our other line plot resources!
[resource:4993632] [resource:4996471] [resource:4992289]


0 Comments
Write a review to help other teachers and parents like yourself. If you'd like to request a change to this resource, or report an error, select the corresponding tab above.