Help your students master data representation with this series of leveled worksheets for creating line plots.
Creating Line Plots from Data
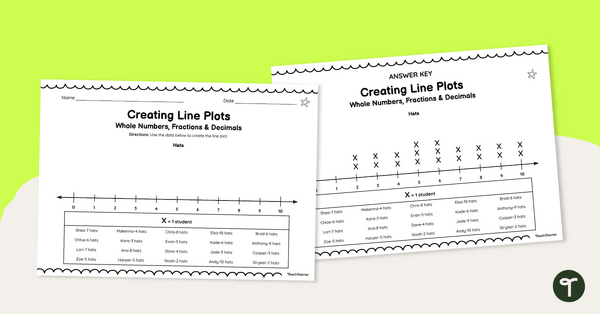
This series of three worksheets for creating line plots requires students to display given data on a line plot using whole numbers, fractions and decimals. The main purpose of this resource is to empower students to create line plots, allowing them to explore the representation of data across various numerical formats. This activity is a stepping stone towards developing strong data analysis skills.
What Are Line Plots?
If you’re introducing this type of data display to your students for the first time, it may be helpful to refresh your own knowledge about line plots!
Line plots (also known as dot plots) are a type of data visualization used in statistics to represent a set of data. They are particularly useful for displaying the distribution and frequency of values within a dataset.
Here’s how a line plot works:
- Data Points: Each data point in the dataset is represented by a dot or point (cross) along a number line.
- Frequency: If multiple data points share the same value, the dots are stacked vertically to indicate the frequency or count of that value.
- Axis: A horizontal number line (X-axis) is used to represent the range of data values, and a dot is placed above each value on the number line to represent the data point.
- Title and Labels: The line plot typically includes a title that describes the dataset or what it represents. It may also include labels for the axes.
Line plots are especially useful for smaller datasets. They provide a quick and visual way to see the distribution of data, identify outliers, and observe trends in the data. They are taught in elementary grades to teach students about data representation and basic statistics.
What’s Included in the Resource Download?
Our “Creating Line Plots Worksheets” package consists of:
- 3 Leveled Worksheets: These worksheets are designed to cater to students with varying levels of proficiency, ensuring that all learners can engage with the material effectively.
- Answer Keys: To simplify the grading process and provide clarity for both teachers and students, answer keys are included.
Using These Line Plots Worksheets in Your Classroom
Here’s a straightforward guide on how to effectively use this resource in your classroom:
- Use the Information Provided: Students are encouraged to create line plots using the data and graph pieces provided within the resource.
- Additional Tools Required: To engage with this resource, the only additional tool students will need is something to write with. This makes it easily accessible and hassle-free for both teachers and students.
This resource is designed to be used as an individual activity, allowing students to work independently at their own pace and gain a sense of ownership over their learning.
Differentiation Strategies
We recognize that every student is unique, which is why our resource provides options for differentiation:
- Challenge for Advanced Students: Assign the more challenging level worksheet to advanced students and engage them with questions that require deeper analysis of the line plots.
- Support for Struggling Students: For students who may find the concept challenging, the less challenging level worksheet is available. Teachers can also demonstrate how to mark data on the line plot, offering additional support.
Make this activity a core part of your lessons to help students master the art of creating line plots with different numerical formats. With this resource, you can empower your students to become confident and proficient data analysts.
This teaching resource was created by Brittany Kellogg, a teacher in Ohio and a Teach Starter Collaborator.
Looking for More Graphs and Data Resources?
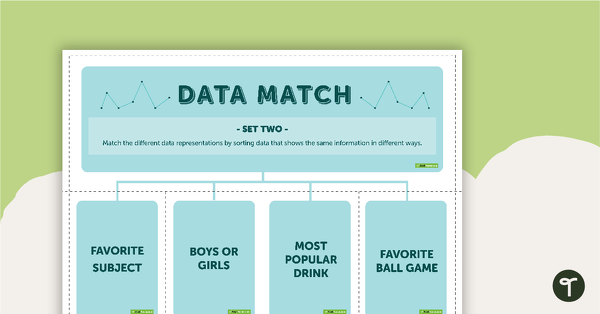
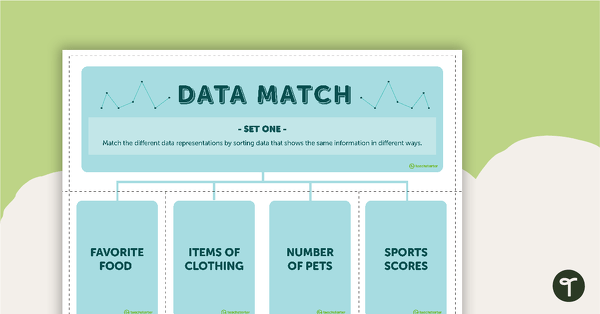
Make sure to check out some of our other line plot resources!
[resource:4993632] [resource:4996471] [resource:4992289]


0 Comments
Write a review to help other teachers and parents like yourself. If you'd like to request a change to this resource, or report an error, select the corresponding tab above.