Graphic Organisers for Teachers
The blank graphic organisers and printable graphic organiser templates you need most for your primary school classroom are here! Help your students learn to brainstorm ideas and organise information with editable templates you can customise for your classroom.
Carefully designed and curated by our expert teacher team, each of the maps, charts and diagrams in this collection of templates has been created with the needs of students in mind. Many are even already aligned to the Australian curriculum to save you much-needed time in your lesson planning.
You'll find:
- Printable Venn Diagram templates
- T-charts
- KWLs
- Story maps
- Concept diagrams
- Concept maps
- Knowledge maps
- Cognitive organisers
- Advance organisers
- Brainstorming templates
Not familiar with this teaching tool, or just looking for some fresh ideas for using them in the classroom? Read on for a primer from our teacher team!
What Is a Graphic Organiser?
A graphic organiser, by definition, is a visual guide that breaks down the relationships between ideas, vocabulary or facts within a learning task. These learning tools scaffold learning for students, allowing them literally construct knowledge. Pretty neat, huh?
Graphic organisers can take the form of templates, charts, or diagrams and be specific to one topic or generalised for use across a range of subjects.
Printing blank templates allows students to use the tool to design their learning, explore relationships between concepts and use their evaluation and judgment skills to determine where information should be added to the organiser.
Types of Graphic Organiser Examples
So what are the different types of graphic organisers in this collection? Let's take a look at some examples and how to use them!
Concept Maps
The term 'map' for this graphic organiser refers to the fact that it shares some similarities with a traditional map.
A map of a country or state can visually represent the geographic layout of different places and their relationships. Similarly, a concept map visually represents the connections and relationships between various ideas or concepts. This helps students organise their thoughts and understand the relationships between different topics, as well as helping kids understand the overall structure of a topic.
Venn Diagrams
A Venn diagram is used to show the logical relationships between two or more sets of items. This tool is named for John Venn, a mathematician, logician and philosopher known for his work in probability.
Although a classic Venn diagram is made up of overlapping circles, other shapes can be used with this graphic organisation tool. And while a Venn Diagram is often made up of just two or three circles, some forms can encompass larger numbers of shapes.
Especially useful in maths and English classes, a Venn diagram can help students easily analyse similarities and differences between characters, objects or concepts. For example, a student might use a Venn diagram in maths to sort and classify numbers or geometric shapes.
Story Maps
A story map is a graphic organiser that can help English students understand the elements of a story — concepts such as characters, setting, plot and resolution.
This helpful tool gives kids a visual outline of the story's structure and helps students identify key elements and their relationships, plus it helps them track plot progression.
KWL Charts
KWL stands for Know-Want to know-Learned, and charts built around this acronym count as graphic organisers! They're used to activate prior knowledge, guide inquiry-based learning and track learning progress.
The goal is for students to fill in what they already know about a topic, what they want to learn, and what they have learned. This gets kids to engage with the content and ask questions!
Cause and Effect Charts
Typically used in history or science, cause and effect charts help students understand the relationship between events or actions.
For example, students can use one of these charts to identify the causes and consequences of a specific event in history or to analyse cause-and-effect relationships in a science experiment.
Flowcharts
Flowcharts use symbols and arrows to represent a sequence of steps or events. This type of organiser tends to be used in subjects like science and maths to help kids visualise processes, procedures and problem-solving strategies.
In science, for example, a student might use a flowchart to illustrate the steps of the water cycle. They could use symbols and arrows to represent each stage, starting with 'Evaporation," followed by 'Condensation,' 'Precipitation' and 'Collection.' Arrows would then connect the steps logically, showing the water flow through the cycle.
Mind Maps
Yup, we have yet another kind of map on this list! Mind maps are diagrams that start with a central idea and branch out to represent related concepts or ideas visually.
You can use these organisers for brainstorming, organising thoughts and making connections between different pieces of information, and they come in handy across a broad range of school subjects.
In writing, for example, a student could use a mind map to generate ideas or outline an essay. Meanwhile, in science class, mind maps can help a student explore different branches of a scientific concept or create visual summaries of key scientific principles.
Comparison Charts
Comparison charts help students analyse similarities and differences between two or more objects, concepts or ideas. They are used to compare and contrast information, such as characteristics of animals, historical figures or different geographical locations.
Let's say a student needs to compare two animals in science class — an elephant and a giraffe.
They could use a comparison chart with columns for different attributes like Size, Habitat, Diet and Physical Features. Under each column, they would then fill in the specific characteristics and compare how elephants and giraffes are different or share similarities.
Timelines
As a graphic organiser, a timeline provides a structured framework for organising and presenting information visually. Students can see the progression of events over time, making it easier to understand historical developments, story plots or the sequence of steps in a process.
A timeline typically includes a horizontal or vertical line representing a specific timespan. Specific points or intervals are marked along the line to indicate specific events or periods. Events are then labelled and positioned relative to when they happen — this way kids can more easily grasp the order of each event and how long each one lasted.
Problem-Solution Charts
Problem-solution charts help students analyse problems and create potential solutions. They typically include sections for identifying the problem, brainstorming possible solutions and evaluating the best way forward.
This organiser can help kids plan a project like solving the problem of waste in the cafeteria. They could identify that the garbage can is always full of items that could be recycled, brainstorm ways to address the issue and come up with a plan to add recycling bins beside the garbage can.
T-Charts
T-Charts are fairly simple graphic organisers.
They divide information into two columns — a line at the top and a line down the centre give this organiser its name — and help students compare and contrast information or categorise data into two categories.
Benefits of Graphic Organiser Templates
Should you use this tool in your classroom to support your students' learning goals? We can't tell you that — but just look at the benefits of graphic organisers!
A graphic organiser helps students organise their ideas, drawing out relationships between ideas or concepts and expressing them in a graphic display. These visual representations or guides may also help students to retain information.
Not sure which organiser you and your students need?
Don't worry; this collection of teaching resources has them all covered!
- Free Plan
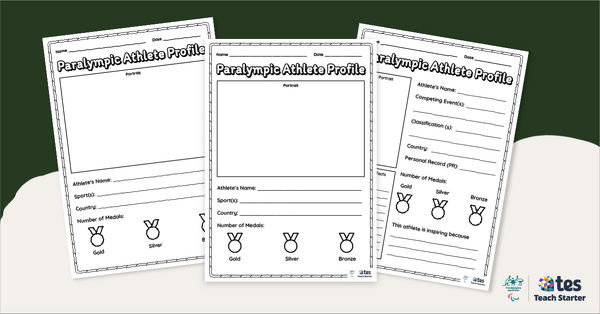
Paralympic Athlete Profile Template
Get your students excited about their favourite para-athletes with our Paralympic Athlete Profile Template.
- Free Plan
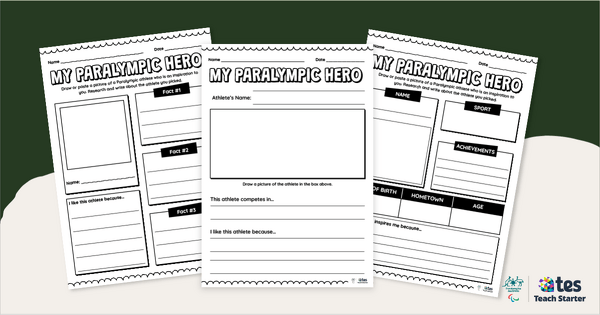
My Paralympic Hero - Athlete Bio Templates
Empower your students to learn about and honour remarkable Paralympic Athletes with these easy-to-use athlete bio templates – ideal for Years 1-5.
- Plus Plan
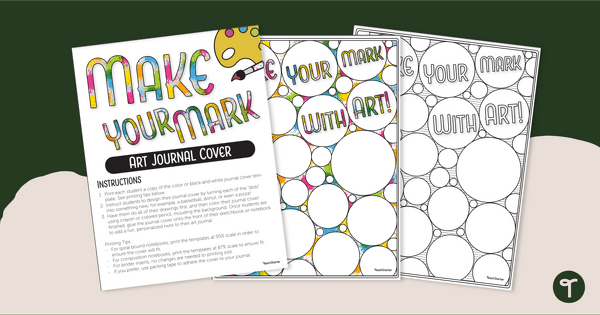
Make Your Mark! Dot Day Art Journal Cover
Encourage creativity and artistic expression by making an art journal with a custom Dot Day Art Journal Cover.
- Plus Plan
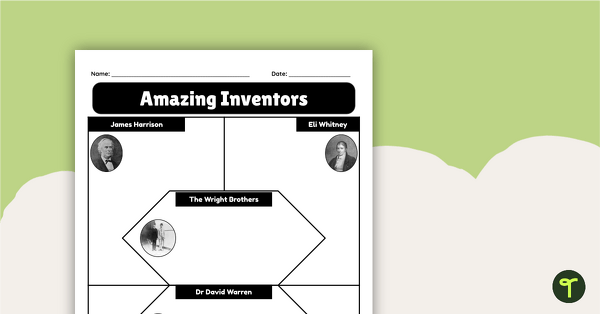
Amazing Innovators Note-Taking Organiser
Record and remember key facts and details about famous inventors with a printable graphic organiser.
- Plus Plan
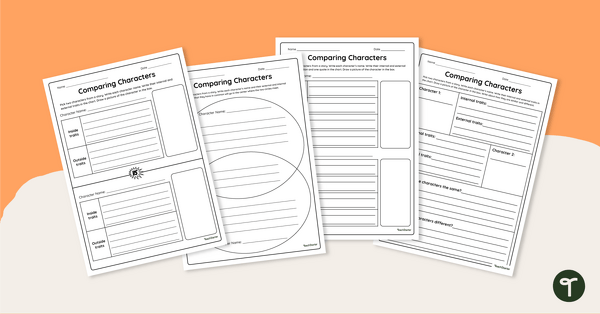
Comparing Characters - Graphic Organisers
Encourage your students to compare story characters with this set of differentiated graphic organisers that can be used with any text.
- Plus Plan
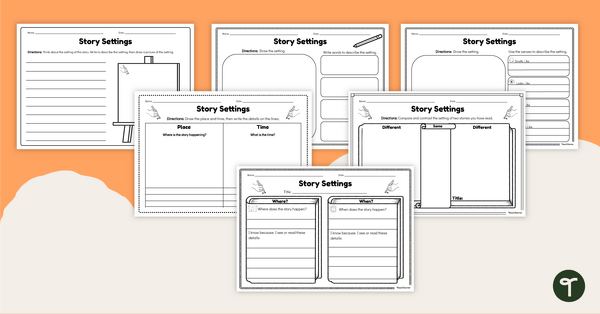
Story Settings - Graphic Organisers
Encourage your students to write and draw about story settings with this set of differentiated graphic organisers.
- Plus Plan
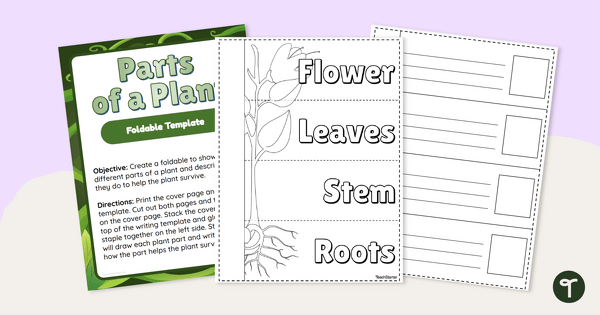
Parts of a Plant Foldable - Lift-the-Flap Graphic Organiser
Display learning about the parts of a plant with a fun “lift the flap” graphic organiser.
- Free Plan
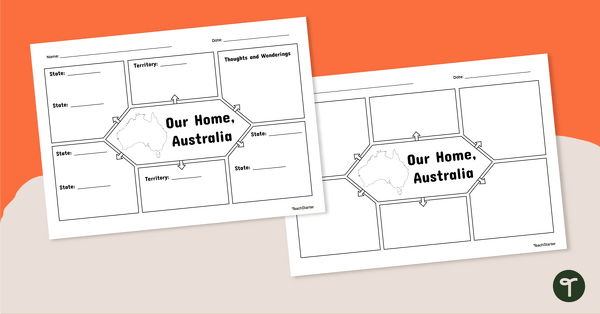
Our Home, Australia: Note-Taking Graphic Organiser
Summarise key information about Australia’s states and territories with this note-taking graphic organiser.
- Plus Plan
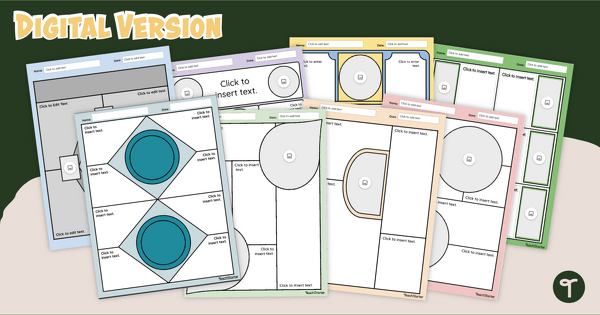
One-Pager Templates — Digital and Print
Display your students' learning on a variety of topics with printable and digital one-pager templates.
- Plus Plan
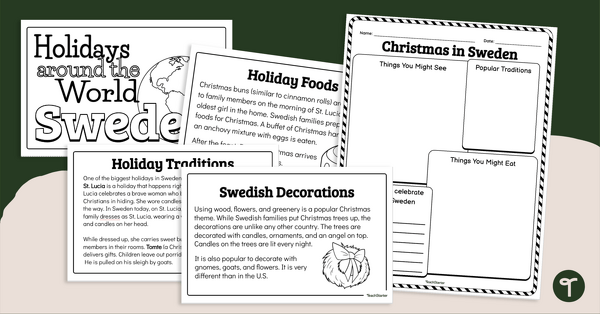
Christmas Around the World Mini Book - Sweden
Introduce your students to Christmas in Sweden with a printable mini book and graphic organiser.
- Plus Plan
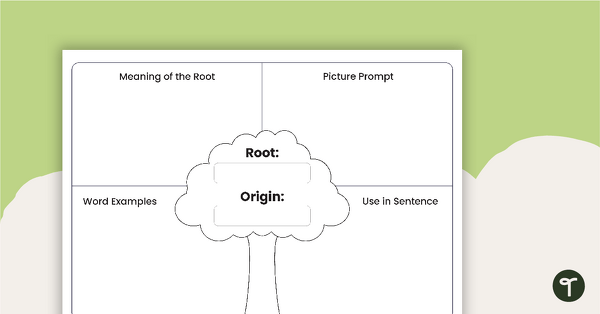
Roots Graphic Organiser Template
Use this graphic organiser to explore roots and their origins.
- Plus Plan
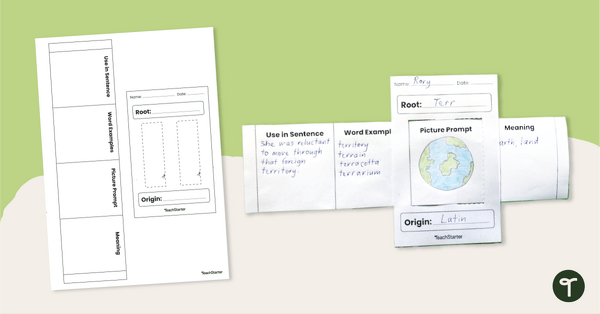
Roots Window Graphic Organiser
Organise ideas about roots and their origins with this graphic organiser.
- Plus Plan
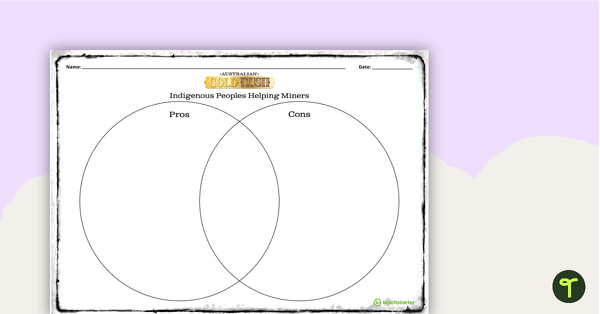
Australian Gold Rush: Native Police Venn Diagram – Template
A Venn diagram template designed to allow students to compare and contrast the pros and cons of Indigenous peoples helping miners and the establishment of the Native Police Force during the Australian Gold Rush.
- Plus Plan
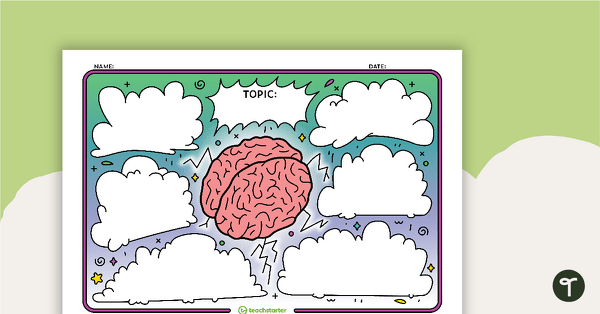
Mind Map Template (Brain)
A printable mind map template for students to use when gathering thoughts and ideas.
- Plus Plan
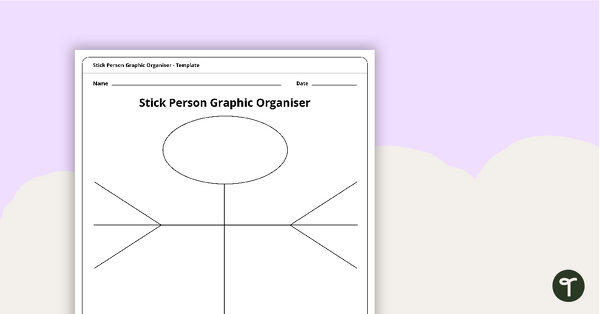
Stick Person Graphic Organiser
A simple and effective graphic organiser that can be used for a wide range of purposes including note taking, mind mapping and planning writing responses.
- Plus Plan
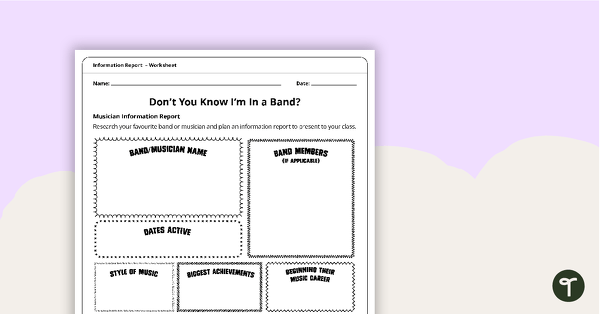
Musical Act Information Report Planner
An information report planning template focusing on a musical act.
- Plus Plan
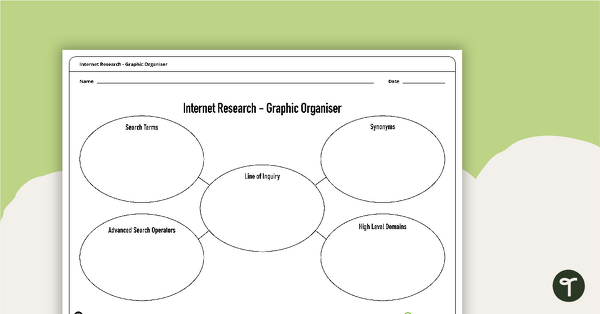
Internet Research - Graphic Organiser
A blank graphic organiser for students to use when planning an Internet research task.
- Plus Plan
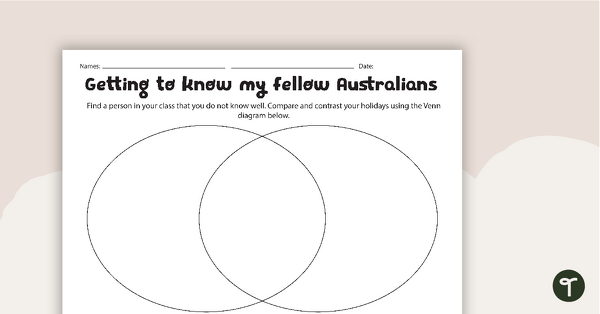
Getting to Know My Fellow Australians - Venn Diagram
An activity for students to compare their holiday experiences with a peer.
- Plus Plan
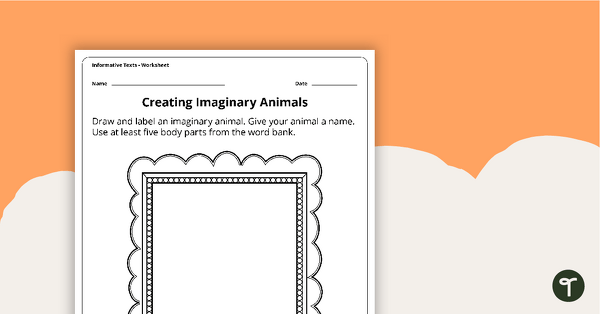
Creating an Imaginary Animal - Descriptive Language Activity
A creative activity to introduce students to descriptive and comparative language.
- Plus Plan
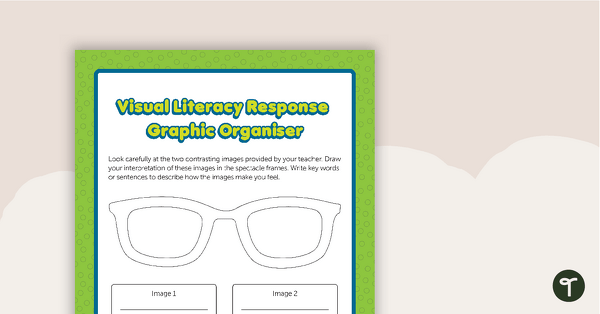
Visual Literacy Graphic Organiser
A worksheet to use when responding to images during visual literacy activities.
- Plus Plan
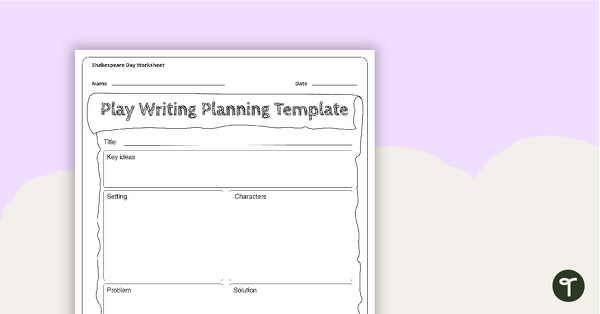
William Shakespeare Play Writing Planning Template
A planning template to use in the classroom when writing a play.
- Plus Plan
T-Chart Graphic Organiser
A blank T-chart graphic organiser.
- Plus Plan
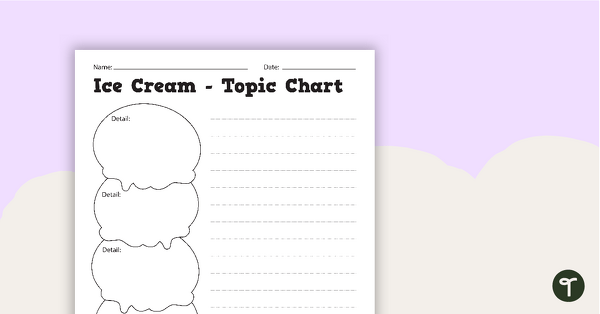
Ice Cream Topic Chart - Graphic Organiser
A blank ice cream themed graphic organiser.
- Plus Plan
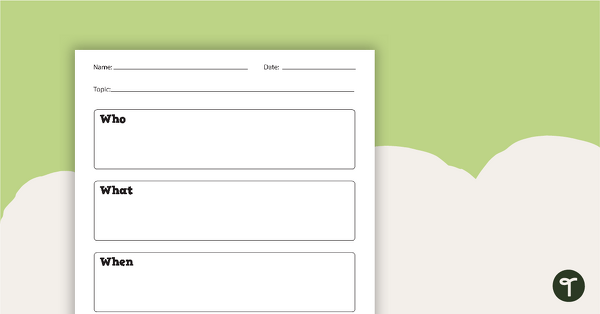
5 W's Graphic Organiser
A blank 5 W's graphic organiser.
- Plus Plan
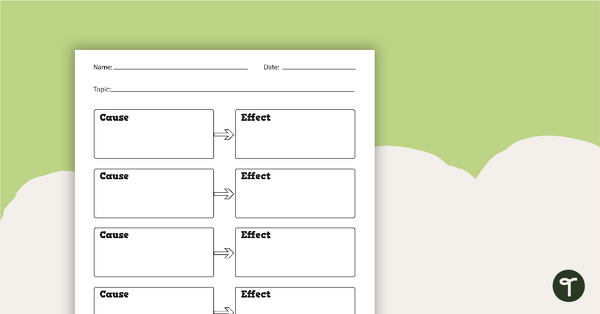
Cause and Effect Chart - Blank
A blank chart to use when identifying cause and effect.
- Plus Plan
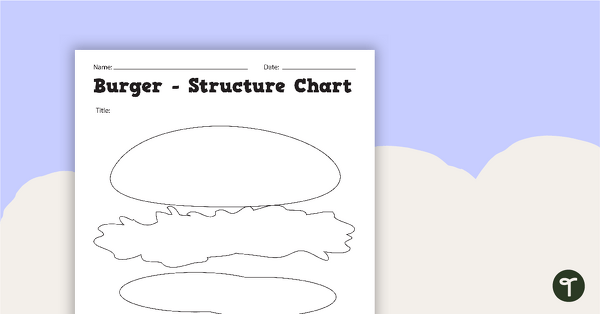
Hamburger Structure Chart - Graphic Organiser
Use this blank hamburger graphic organiser to help students visually outline the key components of a good paragraph.