
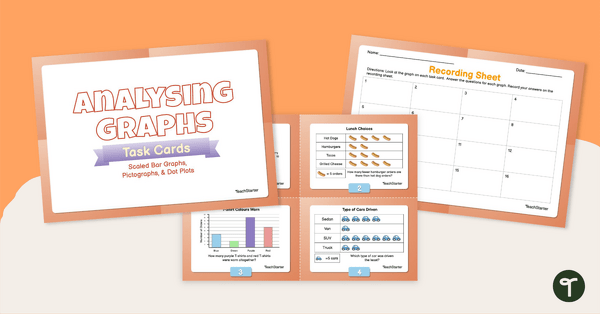
Use data analysis skills to analyse bar graphs and pictographs with this set of task cards.
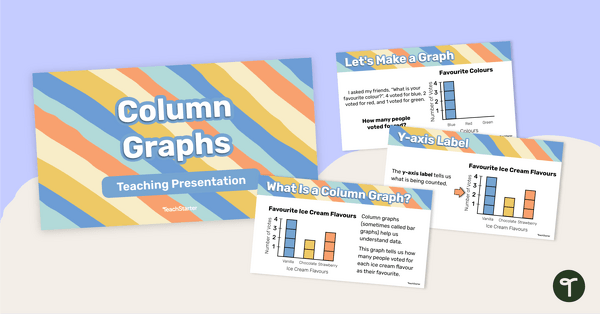
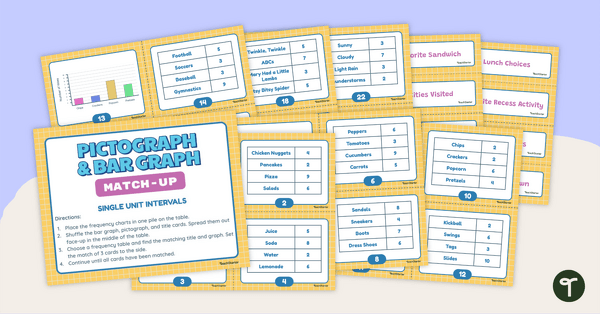
Practise Reading Single-Unit Bar Graphs and Pictographs!
Are your students learning how to read and interpret data? Understanding the difference between different types of data displays can be tricky for young learners! With repeated practise, your students will master how to read single-unit interval graphs in no time!
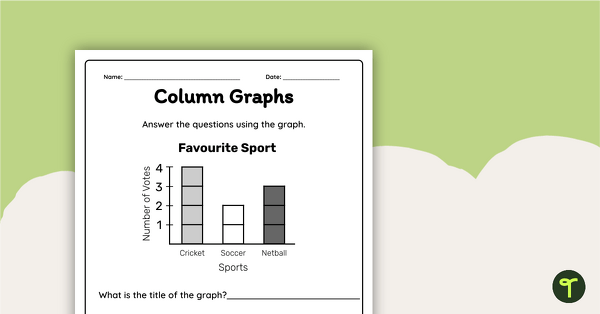
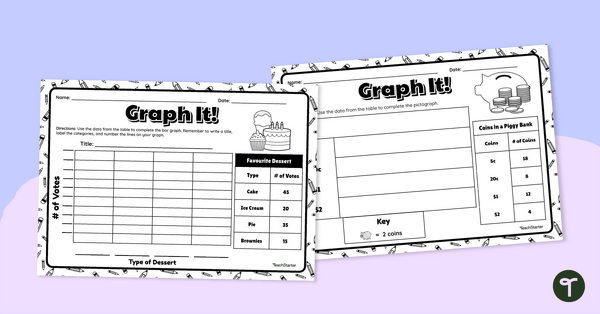
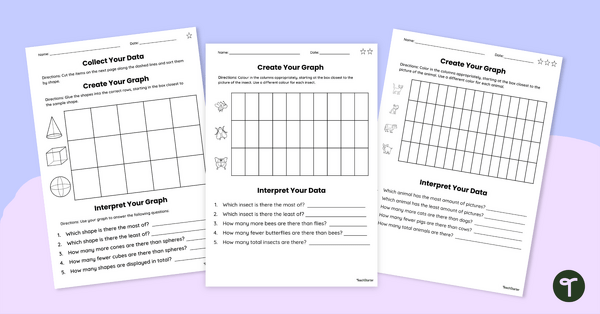
For this activity, students will answer questions based on different bar graphs and pictographs. Students can record their answers on the provided recording sheet.
Through this activity, students will solve one-step word problems involving addition or subtraction using data represented within pictographs and bar graphs with intervals of one.
Tips for Differentiation + Scaffolding
A team of dedicated, experienced educators created this resource to support your maths lessons.
In addition to individual student work time, use this set of data analysis task cards to enhance learning through guided maths groups, whole class lessons, or remote learning assignments.
If you have a mixture of above and below-level learners, check out these suggestions for keeping students on track with the concepts:
🆘 Support Struggling Students
Help students who need support with the concepts by completing the activity in a 1-on-1 setting or with a small group of students. Additionally, if students are struggling to determine the number for each bar graph, provide them with a ruler to help them line up the bars with the numbers on the chart.
➕ Challenge Fast Finishers
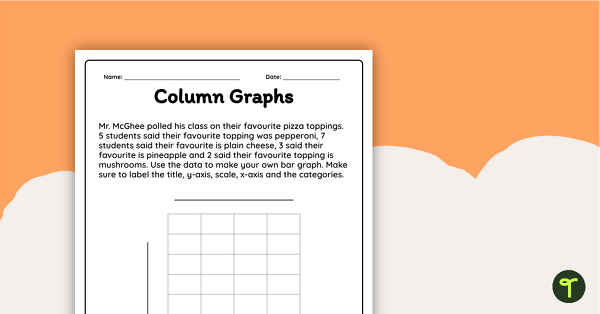
Consider using the scaled unit version of this resource for students who need a bit of a challenge. Additionally, students can generate their own data and create a bar graph or pictograph on a separate sheet of paper.
🛴 Scoot Activity
Place the cards around the room in numerical order and give each student a recording sheet. Assign students or pairs to a starting point card. Give students time to review the card and record their answers in the corresponding space on their paper. Students will rotate to the next card when you say, “SCOOT!” Continue in this manner until students return to their starting point.
👋 Exit Ticket
Use these cards as a formative assessment after your lesson. Pick a random assortment of cards and project them on the board for the whole class to see. Students can record their answers on a sheet of paper, sticky note, or their notebook.
Easily Prepare This Resource for Your Students
Use the dropdown icon on the Download button to choose between the color PDF, black and white PDF, or editable Google Slides version of this resource. A recording sheet and answer key are also included with this download.
Print on card for added durability and longevity. Place all pieces in a folder or large envelope for easy access.
To keep the task cards out of pockets or under desks, punch a hole in the corner of each to place them on a binder ring.
Sustainability Tip: Print a few recording sheets on cardstock and slip them into dry-erase sleeves. Students can record their answers with a whiteboard marker, then erase and reuse them.
This resource was created by Allie Kleijnjans, a teacher and Teach Starter Collaborator.
Don’t stop there! We’ve got more activities and resources that cut down on lesson planning time:
[resource:4840833] [resource:4961188] [resource:5845]


0 Comments
Write a review to help other teachers and parents like yourself. If you'd like to request a change to this resource, or report an error, select the corresponding tab above.