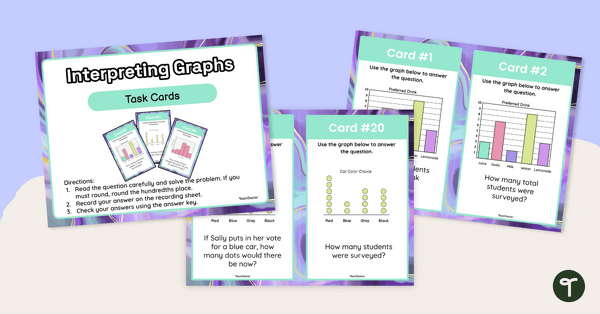
Use this set of task cards students to practise interpreting column graphs, histograms and line plots.
Interpreting Column Graphs, Histograms and Line Plots!
This engaging set of 24 graph interpretation task cards will delight your students. To use, print enough recording sheets for each student to have their own (or, to save paper, have them number off a column in their Maths book, and record answers there). Next simply cut the cards apart, decide to either laminate or glue onto firm cardboard, and store in a container. Students select one card at a time, answer the questions on that card, and replace the card to the container (alternatively, you could set a challenge for students to ‘pass task cards along to their left’ once everyone is finished with their task).
This download includes:
- 24 task cards,
- 1 set of instructions,
- 1 student response page, and
- 1 answer key.
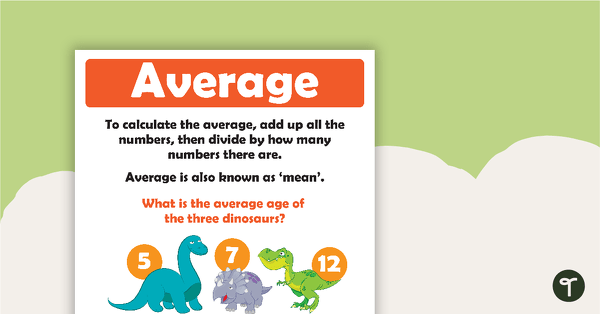
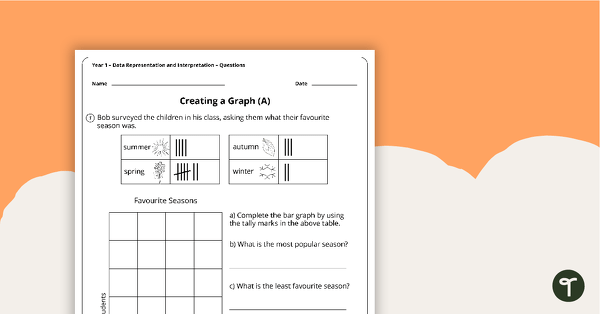
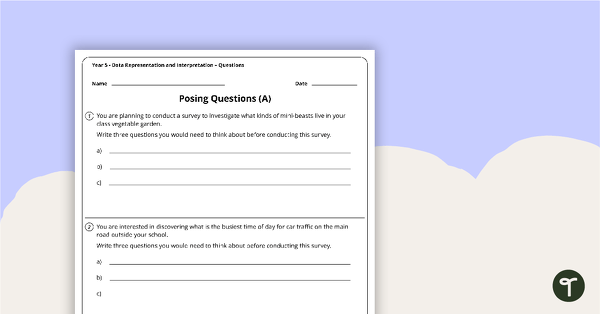
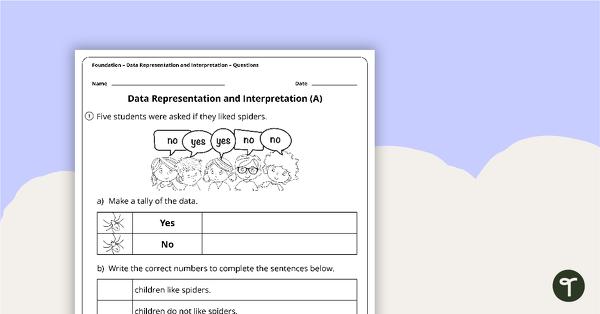
Through this activity, students will develop the ability to interpret various types of data displays, and to provide answers to simple data interpretation questions.
Tips for Differentiation + Scaffolding
A team of dedicated, experienced educators created this resource to support your maths lessons.
In addition to individual student work time, use this maths game to enhance learning through guided groups, whole class lessons, or homework assignments.
If you have a mixture of above and below-level learners, check out these suggestions for keeping students on track with the concepts:
🆘 Support Struggling Students
Laminate the cards so students can circle which part of the graph they are looking at, in order to isolate the relevant data, using a whiteboard marker.
➕ Challenge Fast Finishers
Have students collect their own data by conducting a survey of their classmates and then create a graph and 3 questions about the graph they made.
🛴 Scoot Activity
Place the cards around the room in numerical order and give each student a recording sheet. Assign students or pairs to a starting point card. Give students time to review the card and record their answers in the corresponding space on their paper. Students will rotate to the next card when you say, “SCOOT!” Continue in this manner until students return to their starting point.
👋 Exit Ticket
Use these cards as a formative assessment after your lesson. Pick a random assortment of cards and project them on the board for the whole class to see. Students can record their answers on a sheet of paper, sticky note or notebook.
Easily Prepare This Resource for Your Students
Use the dropdown icon on the Download button to choose between the PDF or Google Slides version of this resource.
Print on cardboard for added durability and longevity. Place all pieces in a folder or large envelope for easy access.
To keep the task cards out of pockets or under desks, punch a hole in the corner of each to place them on a binder ring.
Sustainability Tip: Print a few recording sheets on cardboard and slip them into write-and-wipe sleeves. Students can record their answers with a whiteboard marker, then erase and reuse them.
This resource was created by Cassandra Friesen, a teacher and Teach Starter collaborator.
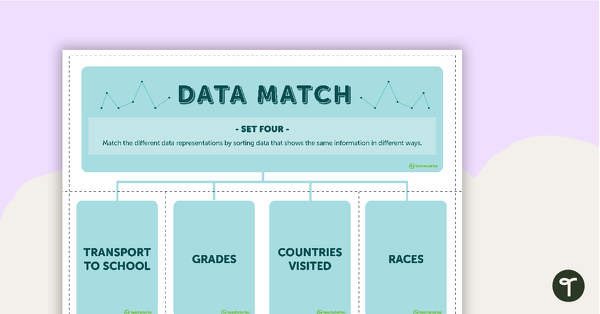
Don’t stop there! We’ve got more graph and data activities to reduce your lesson planning time:
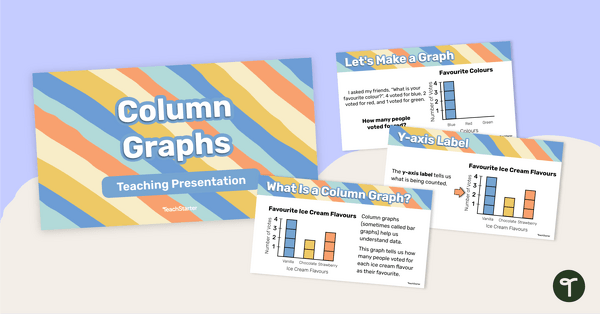
Use data analysis skills to analyse scaled bar graphs, pictographs, and dot plots with this set of task cards. Learn all the features and how to construct a column graph with this 25-page teaching presentation.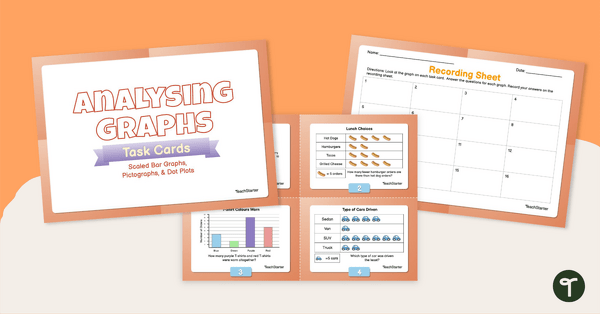
teaching resource
Analysing Graphs — Scaled Bar Graphs, Pictographs, & Dot Plots —Task Cards
teaching resource
Column Graphs – Teaching Presentation


0 Comments
Write a review to help other teachers and parents like yourself. If you'd like to request a change to this resource, or report an error, select the corresponding tab above.