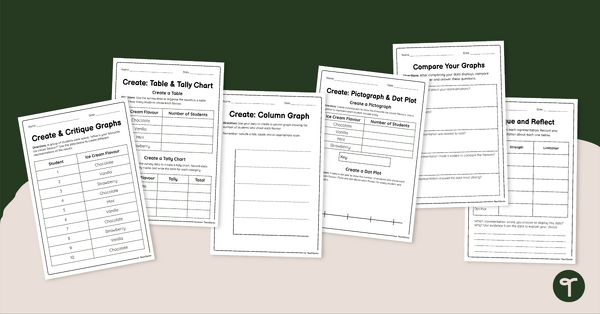
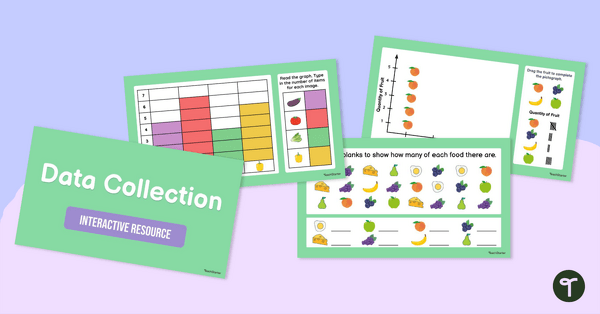
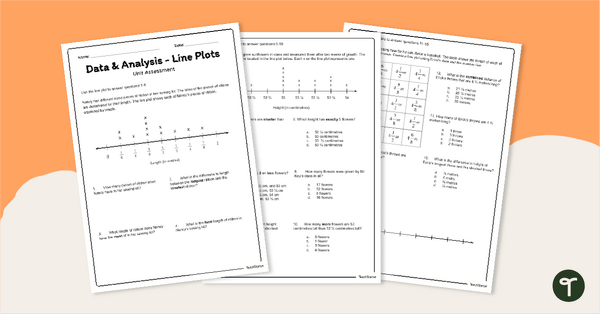
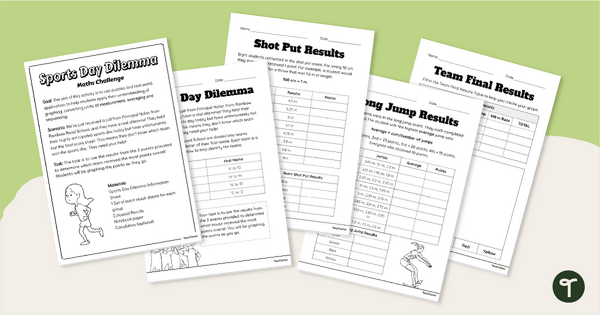
Use this graph comparing worksheet activities to help students create, analyse and compare different data displays.
Graph Comparing Worksheet Activities for Data Representation Skills
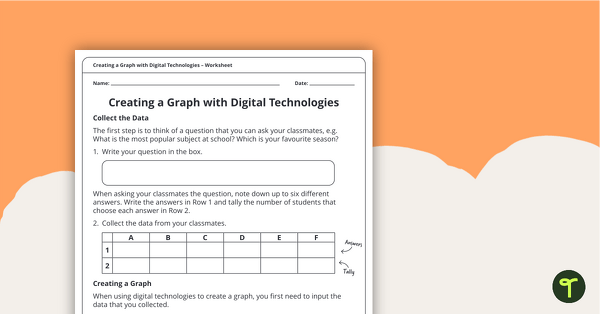
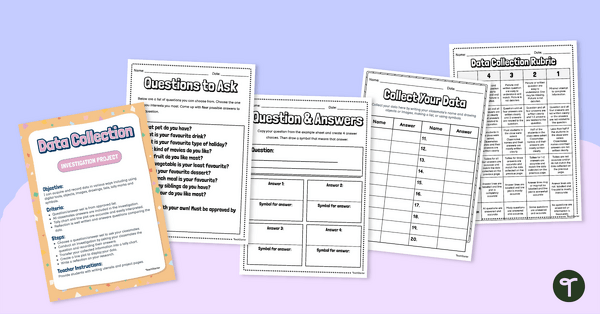
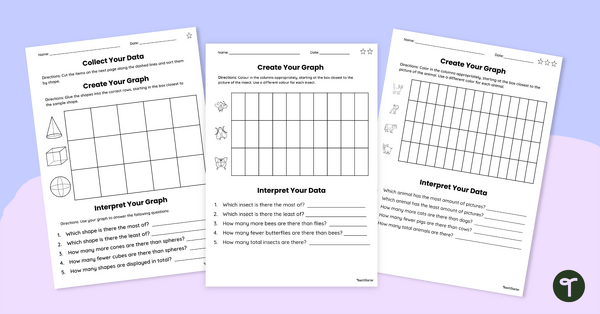
Understanding how data can be displayed in different ways helps students become confident data analysts. This graph comparing worksheet pack provides opportunities for students to create and compare multiple graph types using the same dataset.
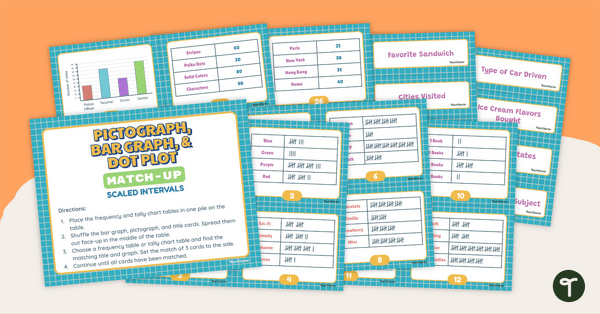
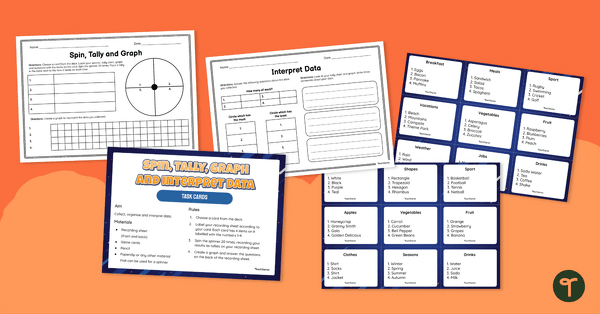
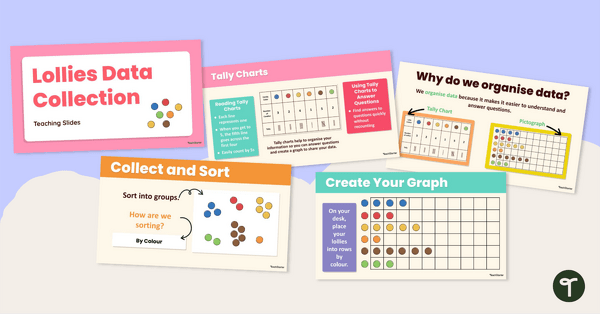
Students work with survey data to create tables, tally charts, column graphs, pictographs and dot plots before evaluating which representation communicates the information most effectively. Through these activities, students develop their ability to organise, display and interpret data.
The resource includes:
- Tables and tally charts
- Column graphs
- Pictographs
- Dot plots
- Graph comparison and reflection activities
Comparing Graphs Worksheet Activities for the Classroom
These comparing graphs worksheet activities can be used in a variety of teaching contexts, including:
- Whole-class lessons – Model different ways to represent the same data.
- Maths rotations – Add the activities to a graphing or statistics station.
- Assessment tasks – Check students’ understanding of creating and interpreting data displays.
By comparing multiple graph types, students learn to think critically about how data is represented.
Download These Graphs Year 4 Worksheets
These graphs year 4 worksheets are available as a ready-to-download PDF and an editable Google Slides version.
Use the Download button to access your preferred file type. Please note that you will be prompted to make your own copy of the Google Slides resource before editing.
This resource was created by Alyssa Peterson, a TeachStarter collaborator.
More Graph Comparing Worksheet Resources
Explore more resources for teaching graphs and data representation.
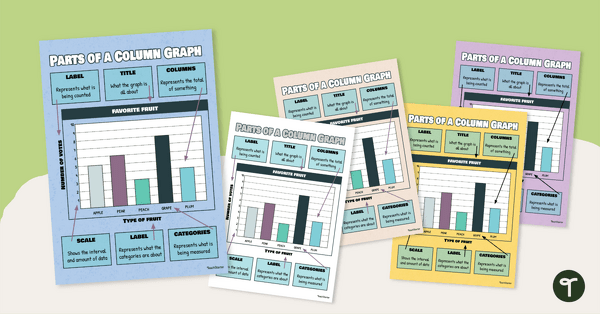
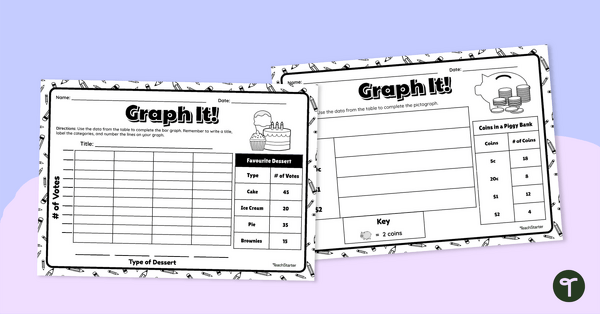
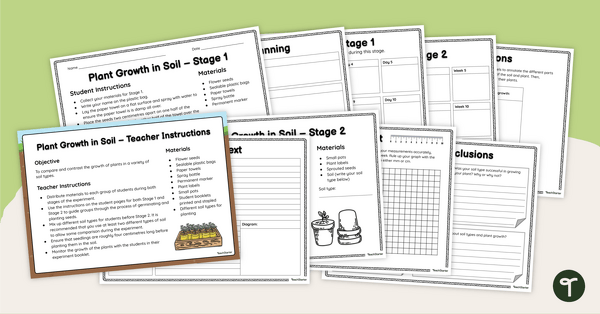
Build data analysis skills with this set of 26 task cards. Hang this column / bar graph poster in your classroom to teach your students about the different parts of this commonly used graph. Draw a scaled picture graph and bar graph to represent data with this worksheet.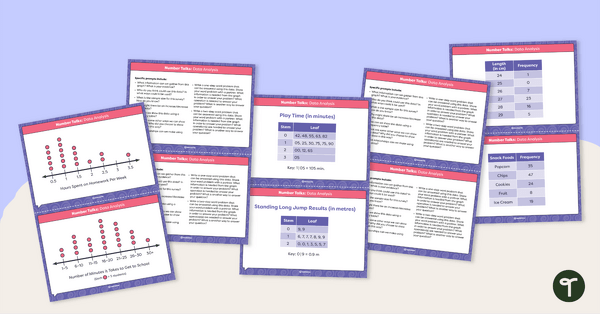
teaching resource
Number Talks - Data Analysis Task Cards
teaching resource
Column / Bar Graph Poster
teaching resource
Graph It! Worksheet (Many-to-One Graphs)

0 Comments
Write a review to help other teachers and parents like yourself. If you'd like to request a change to this resource, or report an error, select the corresponding tab above.