Victorian Curriculum
VC2M4ST02
analyse the effectiveness of different displays or visualisations in illustrating and comparing data distributions, then discuss the shape of distributions and the variation in the data
- suggesting questions that can be answered by a given data display and using the display to answer these questions
- interpreting data representations in the media and other forums where symbols represent one-to-many relationships and how this can be challenging when the representations use part-whole representations
- comparing different student-generated diagrams, tables and graphs, describing their similarities and differences and commenting on the usefulness of each representation for interpreting the data
Show more
5
teaching resources for those 'aha' moments
- Plus Plan
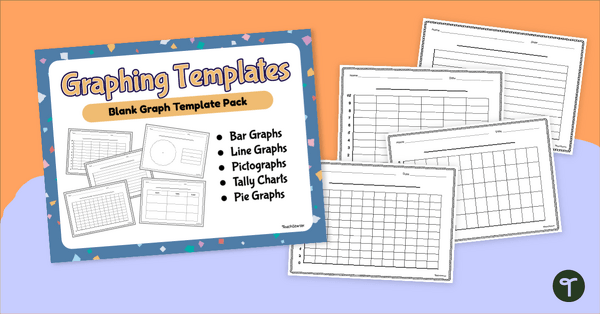
Blank Graph Template Pack
Construct your own graphs with a printable set of Blank Graph Templates.
- Plus Plan
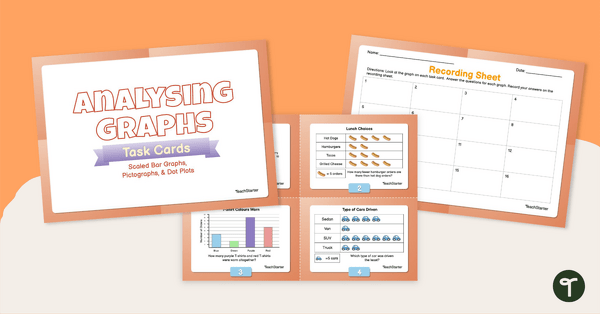
Analysing Graphs — Scaled Bar Graphs, Pictographs, & Dot Plots —Task Cards
Use data analysis skills to analyse scaled bar graphs, pictographs and dot plots with this set of task cards.
- Plus Plan
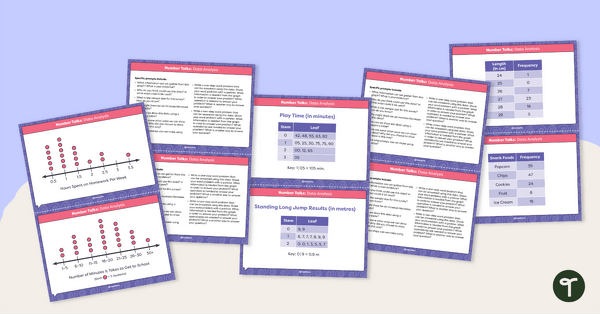
Number Talks - Data Analysis Task Cards
Build data analysis skills with this set of 26 task cards.
- Plus Plan
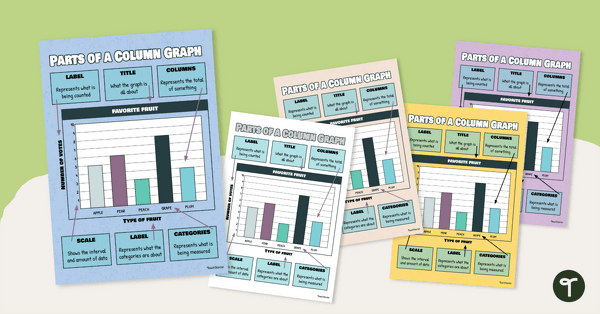
Column / Bar Graph Poster
Hang this column / bar graph poster in your classroom to teach your students about the different parts of this commonly used graph.
- Plus Plan
Types of Graphs Posters and Worksheets
A collection of posters displaying the different types of graphs along with matching worksheets to assist students with laying out graphs on the page.