Victorian Curriculum
VC2M4ST03
conduct statistical investigations, collecting data through survey responses and other methods; record and display data using digital tools; interpret the data and communicate the results
- creating a survey to collect class responses to a preferred movie choice, and recording data responses using spreadsheets; graphing data using a column graph or other appropriate representations; and interpreting the results of the survey and reporting findings back to the class
- conducting a statistical investigation and acquiring data from different online sources; for example, using online query interfaces to select and retrieve data from an online database such as weather records, data frequency mapping software such as Google Trends, or the World Health Organization
- investigating different contexts in which statistical investigations can take place and the types of questions to ask to collect data relevant to the context; for example, investigating supermarket customer complaints that breakfast cereals with the most sugar are positioned at children’s eye level, discussing what questions they would need to ask and answer
Show more
3
teaching resources for those 'aha' moments
- Free Plan
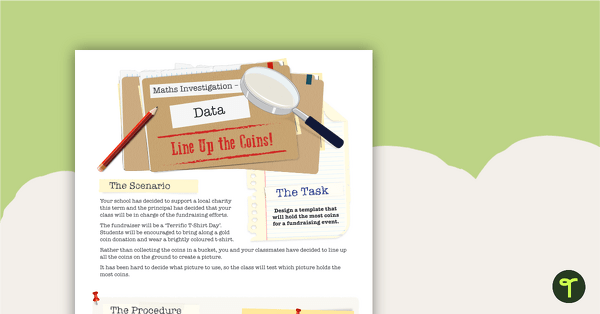
Data Maths Investigation – Line Up the Coins
A mathematics investigation about data, embedded in a real-world context.
- Free Plan

Creating a Graph Using Digital Technologies
A worksheet that supports students when collecting initial data and creating a digital graph.
- Plus Plan

Data Maths Investigation - Which Reward?
A mathematics investigation involving data collection and representation, embedded in a real-world context.