Victorian Curriculum
VCMSP150
Interpret and compare data displays
Show more
5
teaching resources for those 'aha' moments
- Plus Plan

Types of Graphs Posters
This colourful and easy-to-digest visual display shows students the varying data displays they will encounter in their primary maths lessons.
- Plus Plan
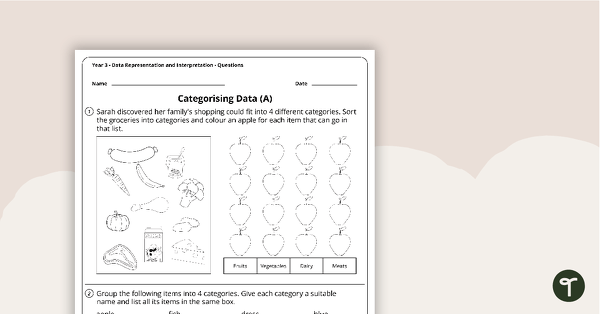
Data Representation and Interpretation Worksheets - Year 3
8 data representation and interpretation worksheets linked to the Australian Curriculum.
- Plus Plan

Types of Graphs Posters and Worksheets
A collection of posters displaying the different types of graphs along with matching worksheets to assist students with laying out graphs on the page.
- Plus Plan

Data Maths Investigation - Which Reward?
A mathematics investigation involving data collection and representation, embedded in a real-world context.
- Plus Plan
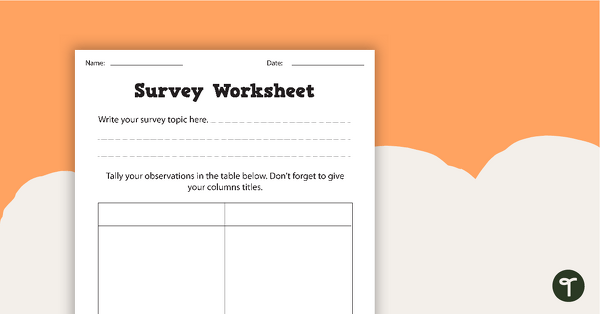
Survey Data Collection Worksheets
A set of worksheets for students to plan survey parameters and tally data.