
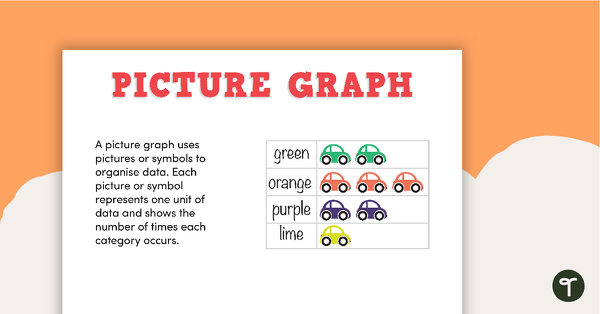
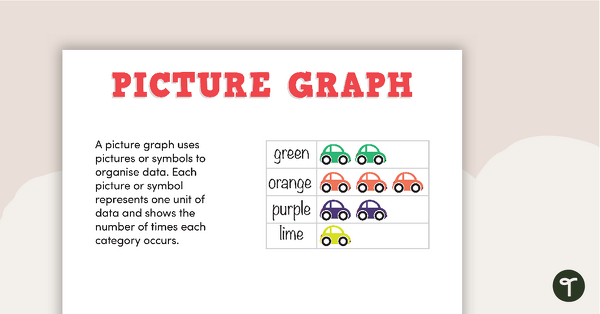
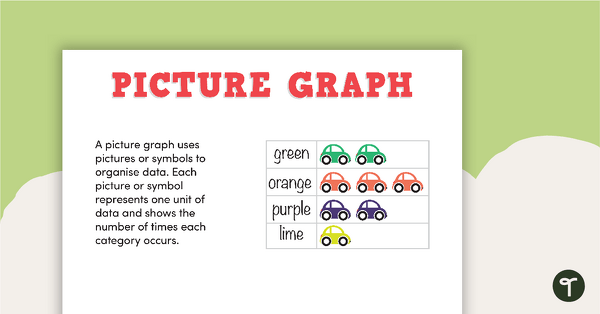
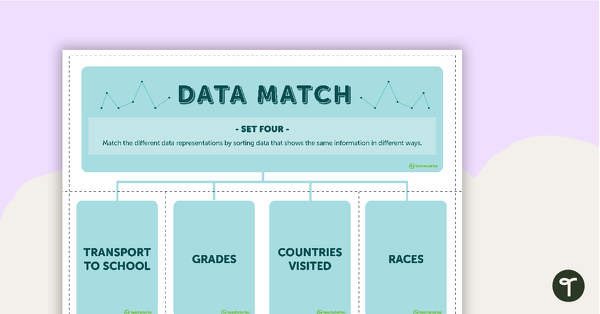
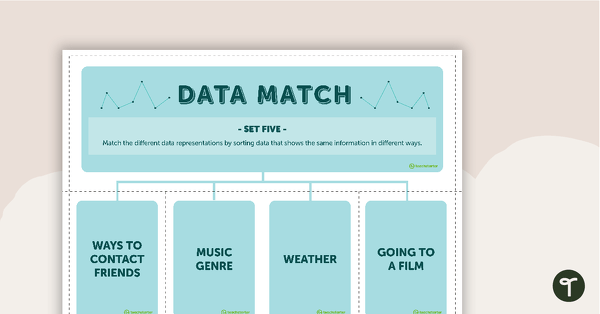
A collection of posters displaying the different types of graphs along with matching worksheets to assist students with laying out graphs on the page.
A set of worksheets and corresponding posters to help students remember the key features of graphs:
- the y-axis is the vertical axis
- the x-axis is the horizontal axis
- Origin is the point where both the x-axis and y-axis are zero and intersect
- Title – relating to the information being displayed on the graph.
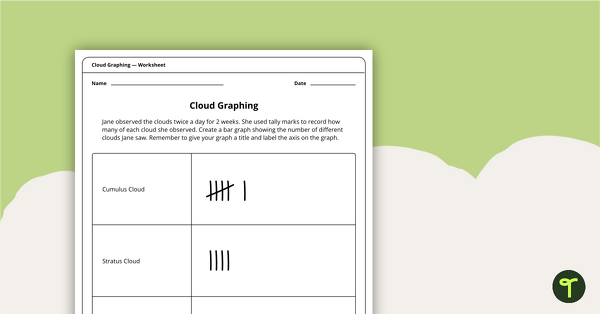
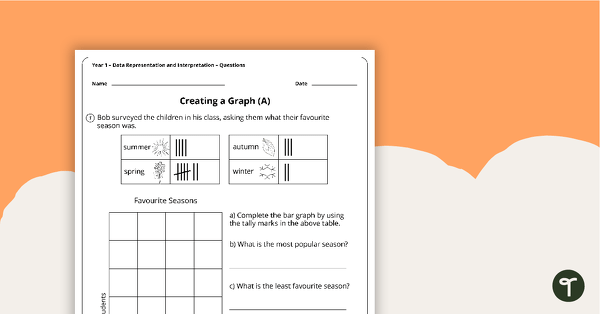
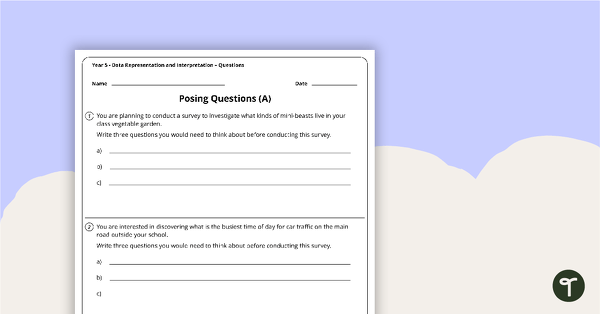
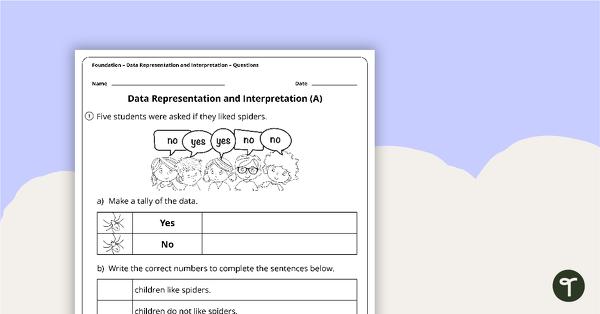
There are two versions of worksheets, a set with written reminders of the key features of a graph and a set with visual reminders. The worksheets can be used in conjunction with these survey data collection worksheets.
You might also like these resources:
[resource:13927] [resource:3412] [resource:4854]


Hi Jenny, Thank you for your message and for your suggestion. Can you please submit a change request to this resource using the Changes & Updates tab on the resource page? This tab can be found near the comments section. If you have any questions along the way, please let me know. I am happy to help! Kind regards Kristian
Could Dot Plots be added to this.