Statistics and Probability
Conduct chance experiments, identify and describe possible outcomes and recognise variation in results
- Plus Plan
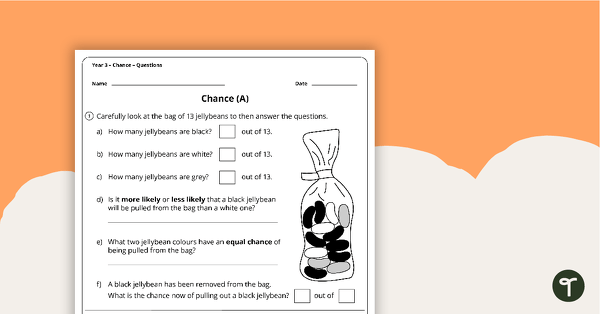
Chance Worksheets - Year 3
2 chance worksheets linked to the Australian Curriculum.
- Plus Plan

Types of Graphs Posters
This colourful and easy-to-digest visual display shows students the varying data displays they will encounter in their primary maths lessons.
- Plus Plan
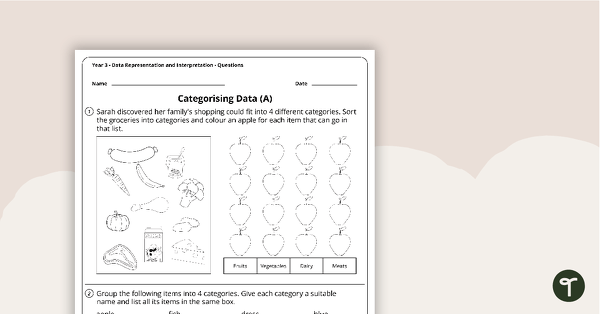
Data Representation and Interpretation Worksheets - Year 3
8 data representation and interpretation worksheets linked to the Australian Curriculum.
- Plus Plan
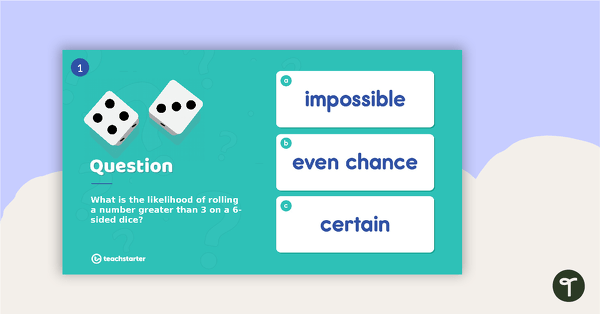
Chance Middle Years PowerPoint
An engaging 36 slide interactive PowerPoint to use in the classroom when learning about chance in the middle years.
- Plus Plan
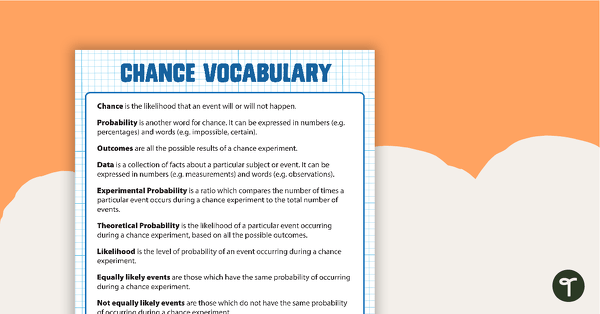
Chance Vocabulary Definitions
A poster with a set of chance vocabulary words and associated definitions.
- Plus Plan
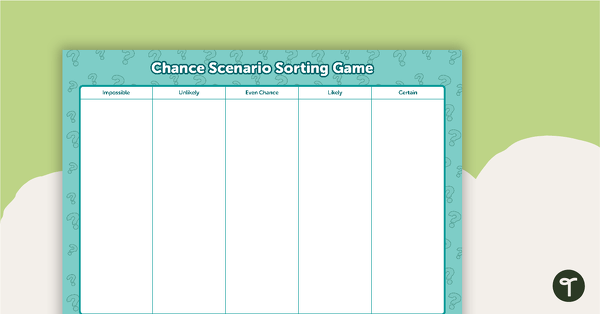
Chance Scenario Sorting Game
A hands-on sorting activity to use when describing possible events and their chances of occurring.
- Plus Plan
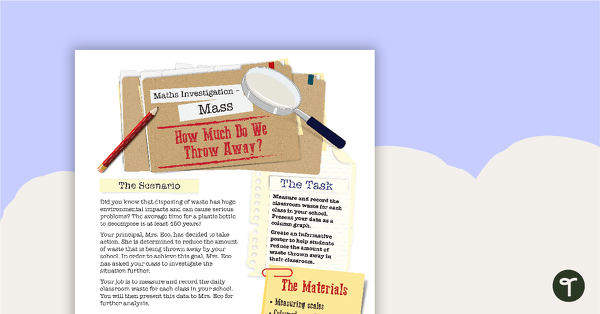
Mass Maths Investigation - How Much Do We Throw Away?
A mathematics investigation about measuring mass, embedded in a real-world context.
- Plus Plan

Types of Graphs Posters and Worksheets
A collection of posters displaying the different types of graphs along with matching worksheets to assist students with laying out graphs on the page.
- Plus Plan
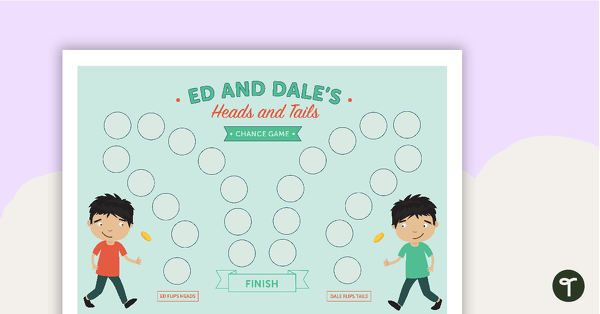
Ed and Dale's Heads and Tails - Chance Game
A fun game of chance for students to play when learning about probability.
- Plus Plan
Blank Graph Template
A blank template for constructing graphs.
- Plus Plan

Data Maths Investigation - Which Reward?
A mathematics investigation involving data collection and representation, embedded in a real-world context.
- Plus Plan

Diving Board Bonanza! - Chance Game
A fun chance game for students to play when learning about probability.
- Plus Plan
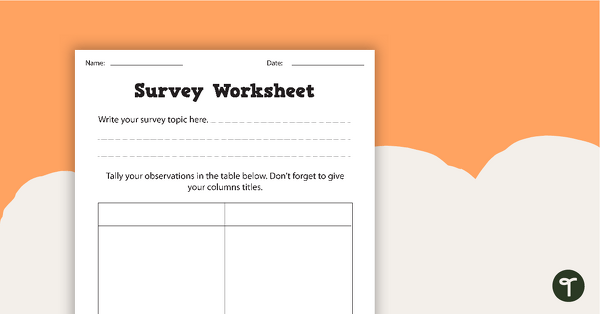
Survey Data Collection Worksheets
A set of worksheets for students to plan survey parameters and tally data.
- Plus Plan
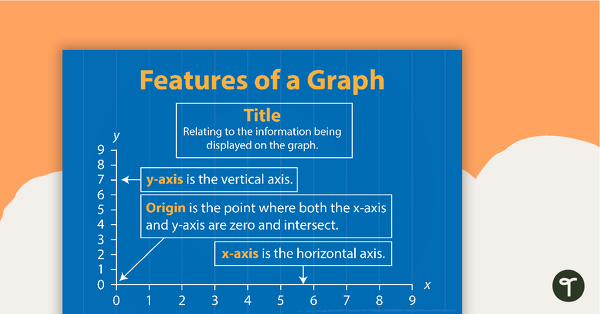
Features of a Graph
A poster showing the main features of a graph.
- Plus Plan
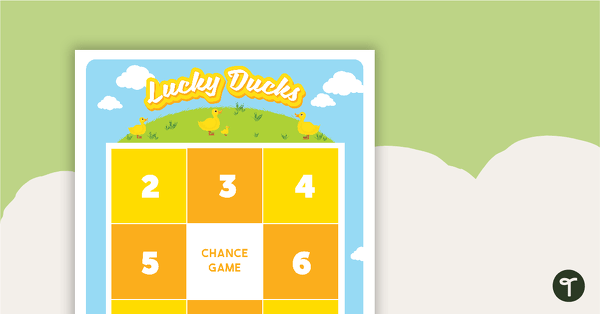
Lucky Ducks - Chance Game
A fun chance game for students to play when learning about probability.
- Plus Plan
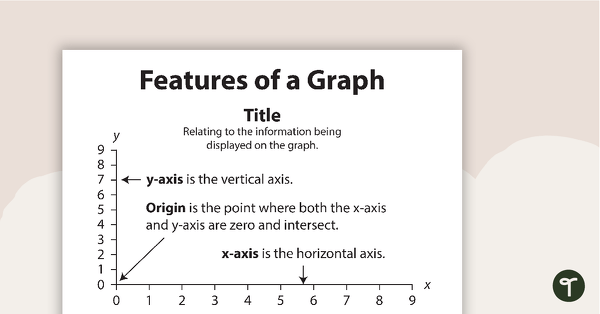
Features of a Graph BW
A poster showing the main features of a graph.