Australian Curriculum V8
Statistics and Probability
Based on the Australian Curriculum, Statistics and Probability in Mathematics Year 3 includes:
Show more
5 of 37
teaching resources for those 'aha' moments
- Plus Plan
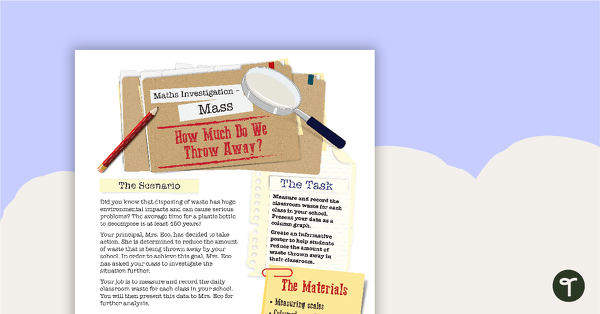
Mass Maths Investigation - How Much Do We Throw Away?
A mathematics investigation about measuring mass, embedded in a real-world context.
- Plus Plan
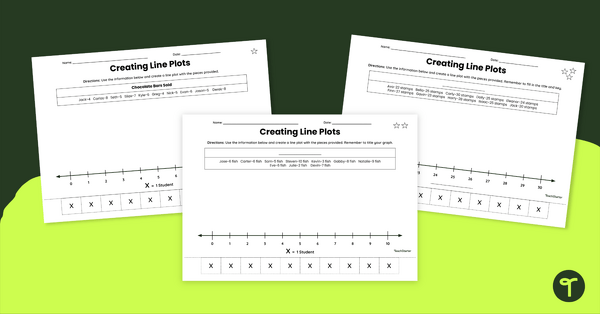
Creating Line Plots Differentiated Cut and Paste Worksheet
Guide students to create line plots with this differentiated cut and paste worksheet.
- Free Plan
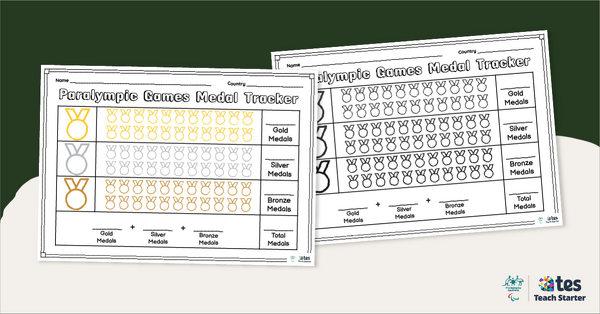
Paralympic Medal Tracking Template
Help your students keep track of the medals won during the Paralympics with our easy-to-use Paralympic medal tracker.
- Plus Plan
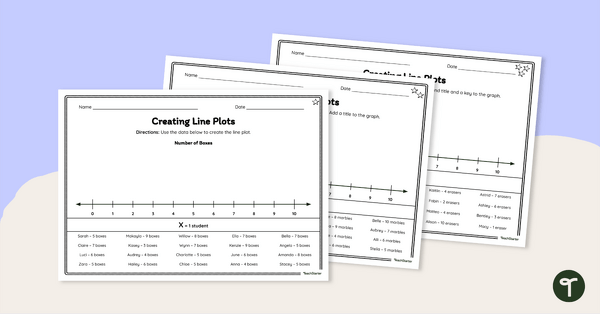
Differentiated Line Plot Worksheet
Guide your students to represent data with this differentiated line plot worksheet.
- Plus Plan
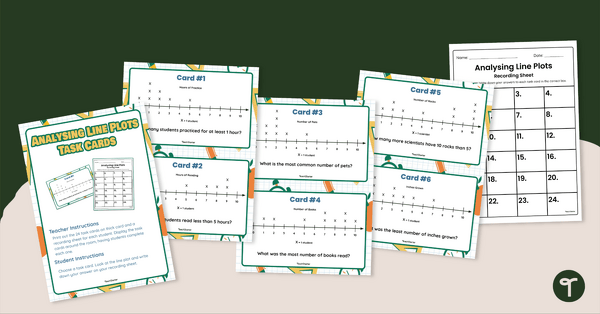
Analysing Dot Plots Task Cards
Strengthen data analysis skills by interpreting dot plots with this set of 24 task cards.