Data representation and interpretation
Based on the Australian Curriculum, Data representation and interpretation in Mathematics Year 3 includes:
- ACMSP068 Identify questions or issues for categorical variables. Identify data sources and plan methods of data collection and recording
- ACMSP069 Collect data, organise into categories and create displays using lists, tables, picture graphs and simple column graphs, with and without the use of digital technologies
- ACMSP070 Interpret and compare data displays
- Plus Plan
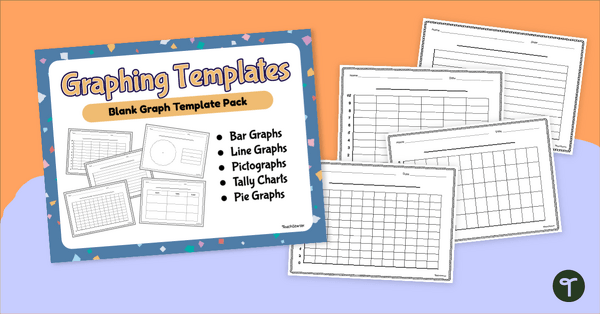
Blank Graph Template Pack
Construct your own graphs with a printable set of Blank Graph Templates.
- Plus Plan
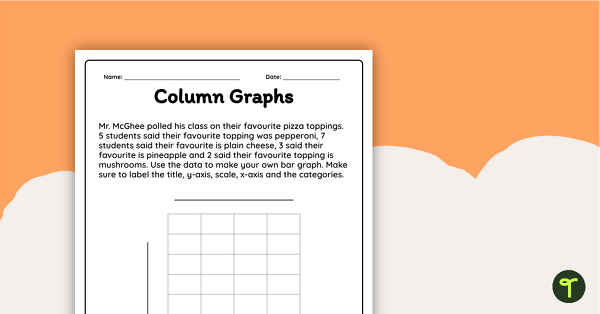
Creating a Bar Graph Worksheet
Interpret data and create a column graph display with this worksheet.
- Plus Plan
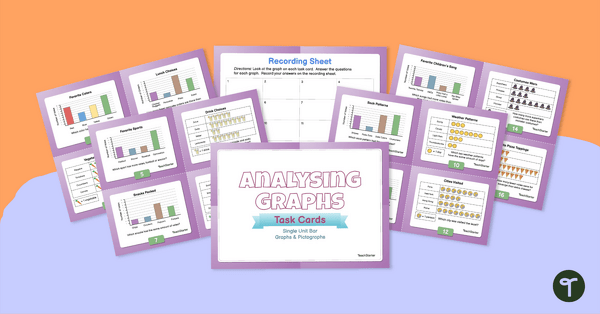
Analysing Graphs – Single-Unit Bar Graphs and Pictographs – Task Cards
Use data analysis skills to analyse bar graphs and pictographs with this set of task cards.
- Plus Plan
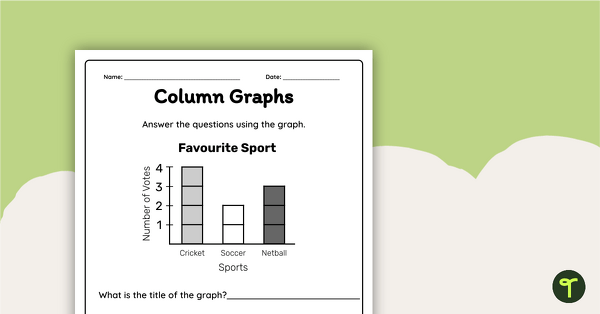
Interpreting a Column Graph Worksheet
Interpret information from a column graph and answer questions with this worksheet.
- Plus Plan
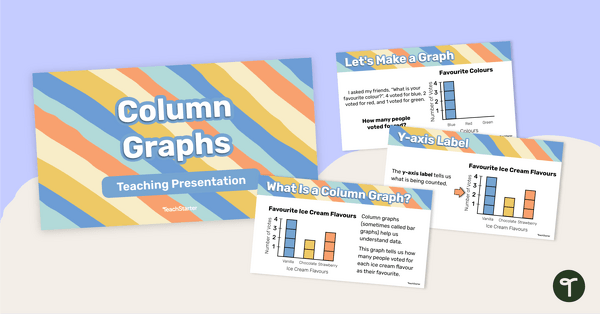
Column Graphs – Teaching Presentation
Learn all the features and how to construct a column graph with this 25-page teaching presentation.
- Free Plan
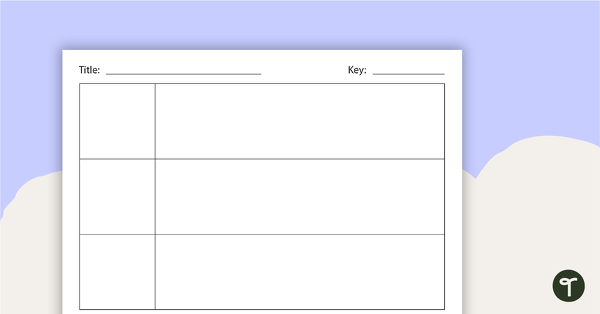
Picture Graph Templates
A set of blank picture graph templates for students to represent data.
- Plus Plan
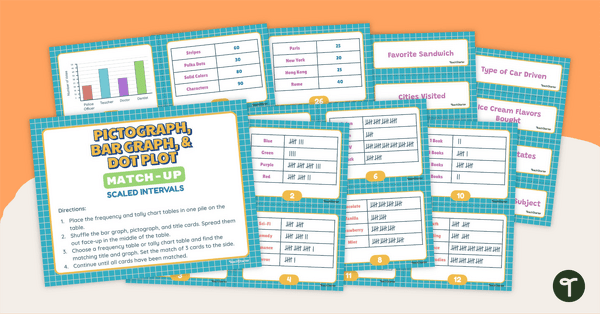
Pictograph, Bar Graph and Dot Plot Match-Up (Scaled Intervals)
Use data analysis skills to match tally charts and frequency tables with their corresponding bar graph, pictograph or dot plot.
- Plus Plan
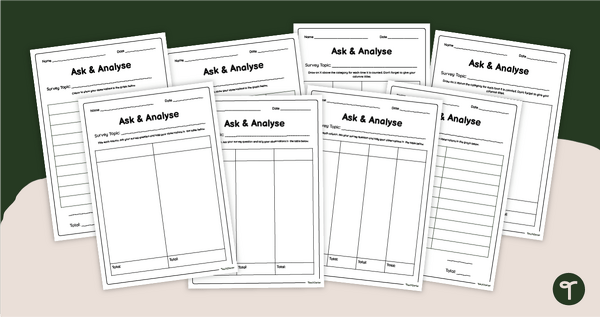
Editable Blank Survey Template For Students
Organise student survey data with a set of printable blank survey templates.
- Plus Plan
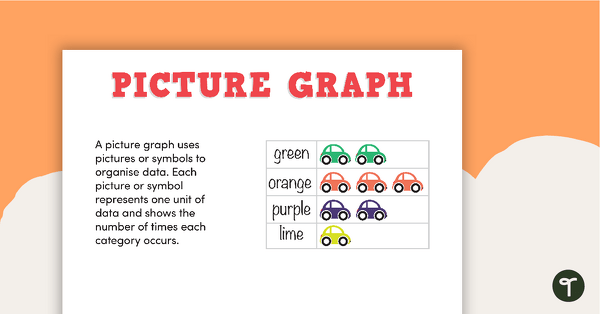
Types of Graphs Posters and Worksheets
A collection of posters displaying the different types of graphs along with matching worksheets to assist students with laying out graphs on the page.
- Plus Plan
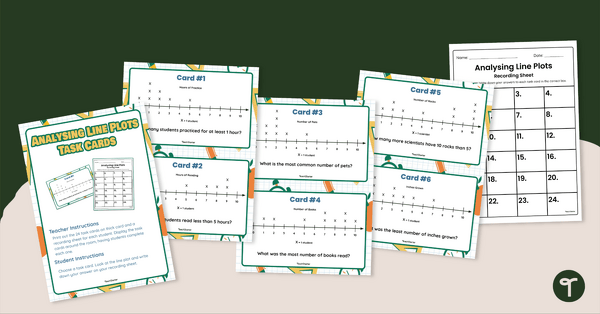
Analysing Dot Plots Task Cards
Strengthen data analysis skills by interpreting dot plots with this set of 24 task cards.