Encourage your students to practise reading and creating histogram graphs using this double-sided worksheet with answer key included.
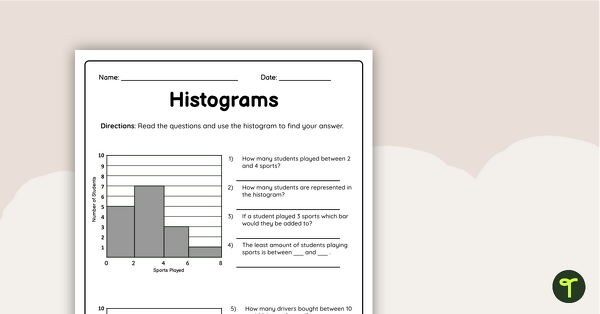
Reading and Creating Histograms Worksheet
Histograms are a useful tool for visualising data in a way that helps students understand patterns and trends. In primary school, introducing histograms can be simplified to make them accessible and engaging for young learners.
Use this double-sided histograms worksheet to give students the opportunity to both interpret histograms, and create histograms to represent a given data set.
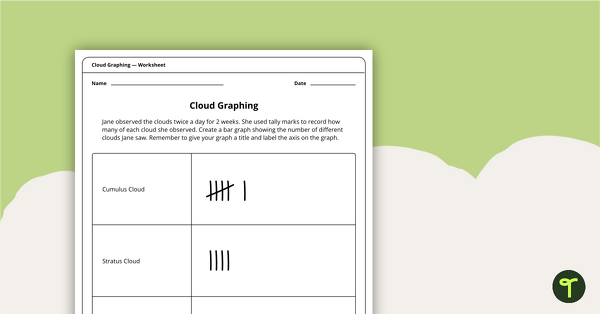
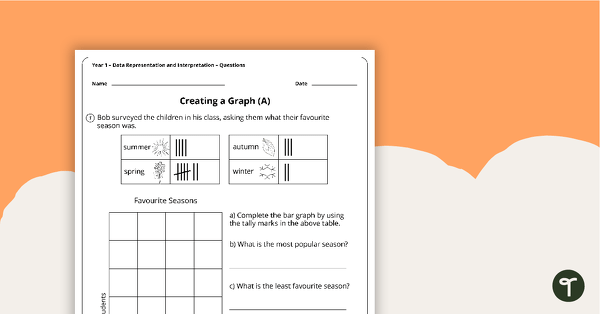
This worksheet uses simple, real-life scenarios (such as fuel used by vehicles, and students’ favourite sports).
You may like to use this worksheet as an individual task, or as a whole-class instruction (project onto your smartboard and have students take notes in their books).
To introduce this activity, revisit some graph vocabulary at the start of your lesson, so that students understand key terms like categories, frequency, bars, and axis labels. Encourage them to use these terms when discussing histograms.
This resource uses simple and relatable examples to make the concept of histograms more accessible to young learners. Reinforce the idea that histograms are tools that help us understand data more easily by showing patterns and distributions visually. By incorporating interactive activities and making it enjoyable, you can foster a positive attitude towards data representation and analysis in primary school students.
An answer key is included with your download to make marking fast and easy!
Tips for Differentiation Using the Histogram Worksheet
In addition to individual student work time, use this worksheet as a:
- Maths specific rotation or guided group
- lesson exit ticket
- fast finisher activity
- homework assignment
- whole-class review (via smartboard)
To make this activity more challenging for fast finishers, edit the worksheet in Google Slides to include more challenging data sets, including scaled intervals.
Offer students who require additional support additional resources, such as manipulatives to represent the values and assist with understanding representations.
Easily Download & Print
Use the dropdown icon on the Download button to choose between the PDF or Google Slides version of this resource.
Because this resource includes an answer sheet, we recommend you print one copy of the entire file. Then, make photocopies of the blank worksheet for students to complete.
To save paper, we suggest printing this 2-page worksheet double-sided.
This resource was created by Cassandra Friesen, a teacher and Teach Starter collaborator.
Don’t stop there! We’ve got more graph and data activities to reduce your lesson planning time:
[resource:4992823] [resource:4855531 ] [resource:4849571]


0 Comments
Write a review to help other teachers and parents like yourself. If you'd like to request a change to this resource, or report an error, select the corresponding tab above.