Statistics and Probability
Based on the Australian Curriculum, Statistics and Probability in Mathematics Year 5 includes:
- Free Plan
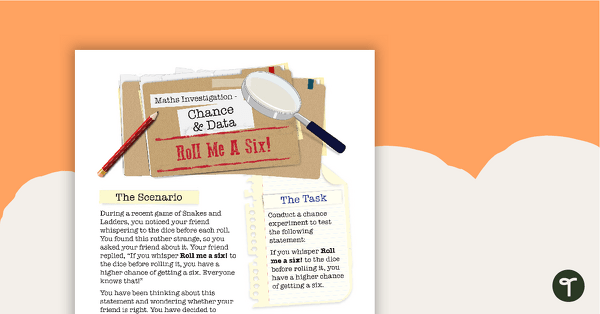
Chance and Data Maths Investigation - Roll Me a Six!
A mathematics investigation involving chance and data, embedded in a real-world context.
- Plus Plan
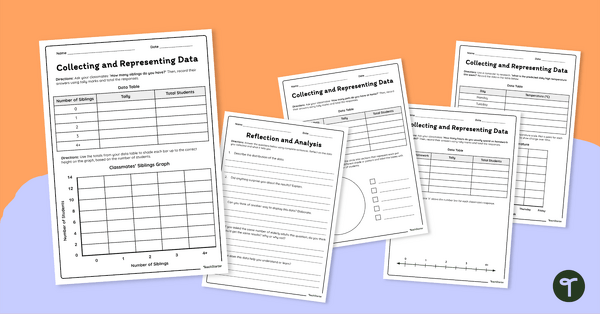
Collecting and Representing Data Worksheet Set
Download our collecting and representing data worksheet set to get your students collecting, organising and displaying data.
- Plus Plan
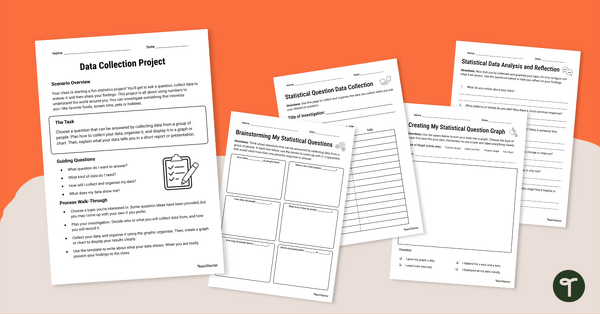
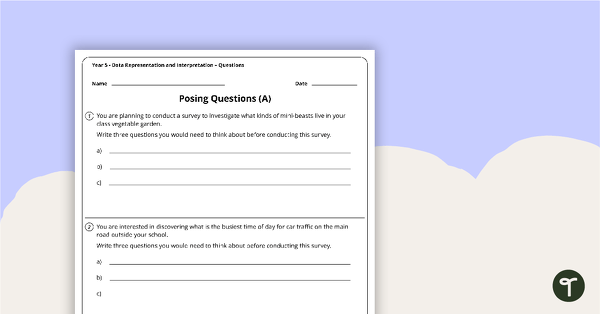
Data Collection Project
Complete this data collection project with your students to give them practise developing a statistical question, collecting data and displaying the results.
- Plus Plan
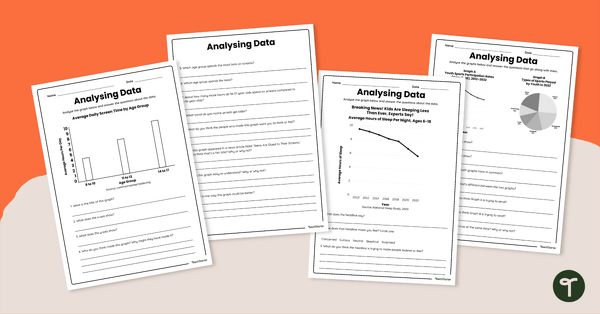
Analysing Data Worksheet Set
Share this analysing data worksheet set with your students to give them varied practice interpreting multiple data representations.
- Plus Plan
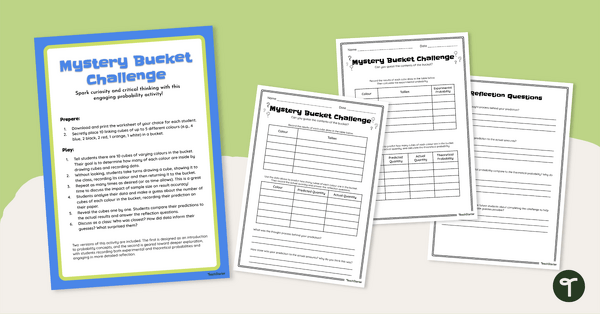
Probability Experiments — Mystery Bucket Challenge
Conduct probability experiments like our ‘Mystery Bucket Challenge’ to give your students hands-on experience with concepts of chance.
- Plus Plan

Types of Graphs Posters and Worksheets
A collection of posters displaying the different types of graphs along with matching worksheets to assist students with laying out graphs on the page.
- Plus Plan
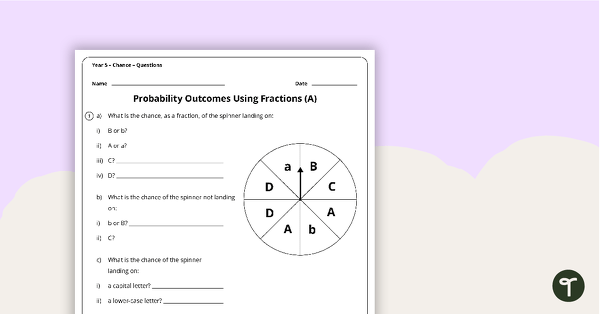
Chance Worksheets - Year 5
4 chance worksheets linked to the Australian Curriculum.
- Plus Plan
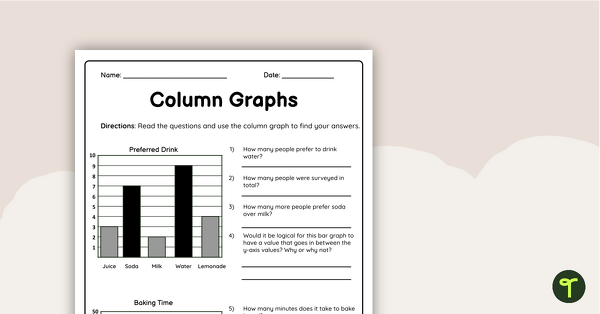
Column Graphs Grade 5 Worksheet
Use this double-sided column graphs worksheet to check your students’ understanding of interpreting and drawing column graphs.
- Plus Plan
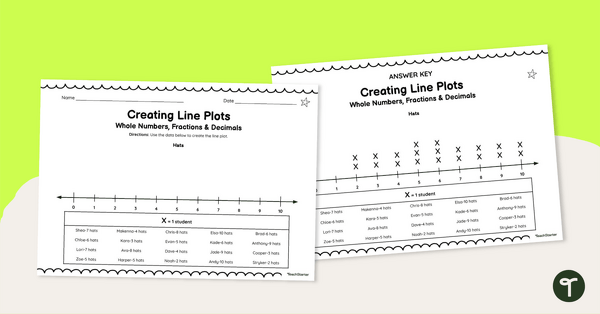
Creating Line Plots (With Whole Numbers, Fractions and Decimals) Worksheets
Help your students master data representation with this series of leveled worksheets for creating line plots.
- Plus Plan
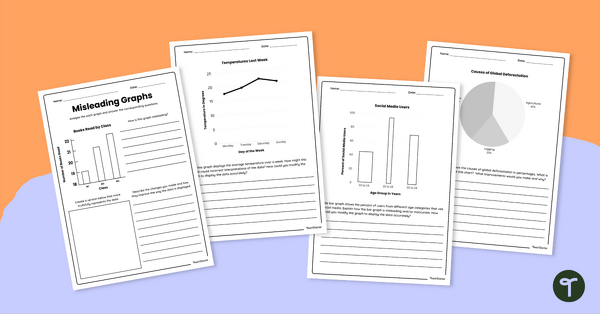
Misleading Graphs Worksheet Set
Download our misleading graphs worksheet set to increase your students’ abilities in statistical literacy and data analysis.
- Free Plan

Creating a Graph Using Digital Technologies
A worksheet that supports students when collecting initial data and creating a digital graph.
- Plus Plan
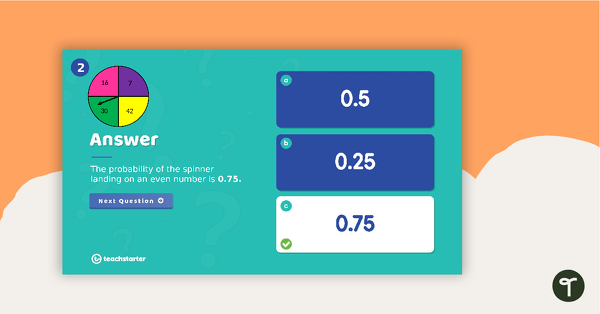
Chance and Probability Upper Years PowerPoint
An engaging 30 slide interactive PowerPoint to use in the classroom when learning about chance and probability in the upper years.
- Plus Plan
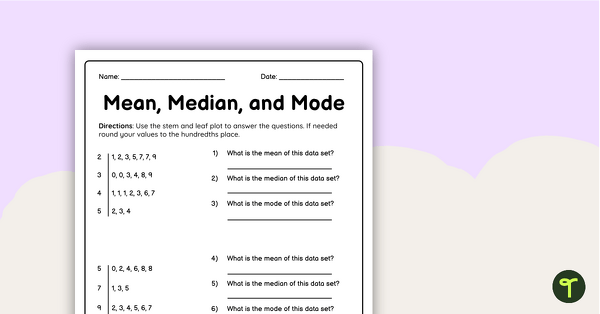
Mean Median Mode Worksheet
Use this double-sided worksheet to check students’ ability to find the mean, median and mode of given data sets.
- Plus Plan
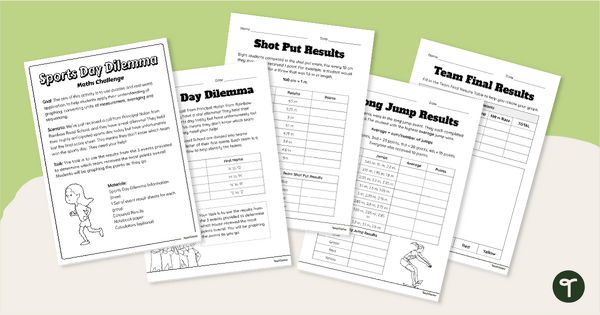
Sports Day Dilemma - Metric Conversions Maths Task
Engage students with a real-world application of measurement conversions with Sports Day Dilemma, a metric conversion maths task!
- Plus Plan
Data Representation and Interpretation Worksheets - Year 5
8 data representation and interpretation worksheets linked to the Australian Curriculum.
- Plus Plan
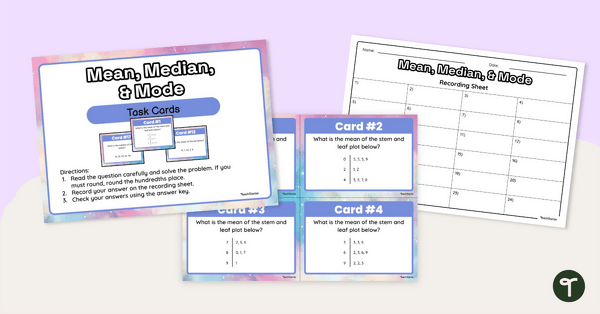
Mean Median and Mode Task Cards
Use this set of 24 data interpretation task cards to teach students to find the mean, median and mode of a limited data set.
- Plus Plan
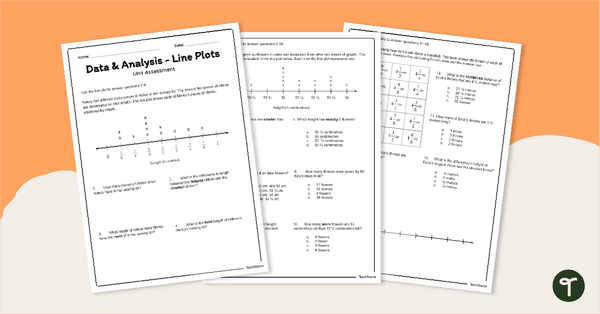
Line Plots / Dot Plots - Year 5 Assessment
Assess student understanding of reading and creating dot plots/line plots with a printable assessment for Year 5.
- Plus Plan
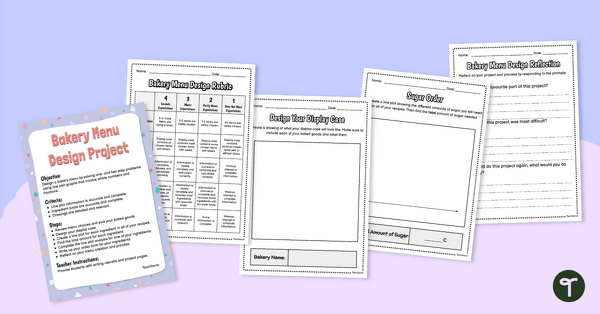
Line Plot Project: Bakery Menu Design
Make learning about maths as sweet as your students' favourite treats with this project based learning line plots exercise!
- Plus Plan
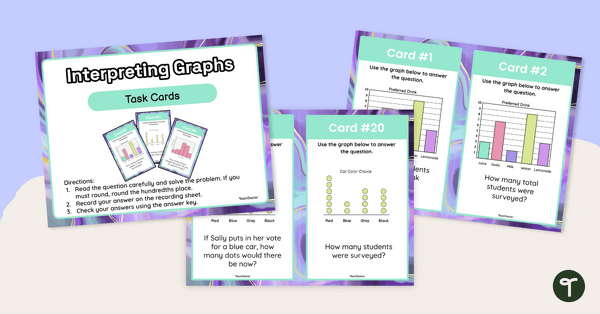
Interpreting Graphs Task Cards
Use this set of task cards students to practise interpreting column graphs, histograms and line plots.
- Plus Plan

Class Carnival – Probability STEM Challenges
A set of four carnival-themed STEM challenges where students create fun games that incorporate probability.
- Plus Plan
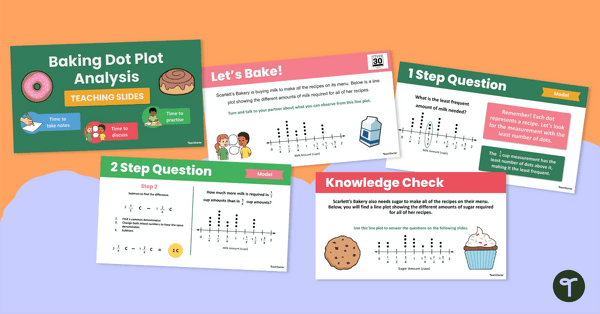
Baking Dot Plot Analysis Teaching Slides
Explore the sweet side of graphs and data with this bakery-themed dot plot resource, supporting your students' abilities to interpret dot plots!
- Plus Plan
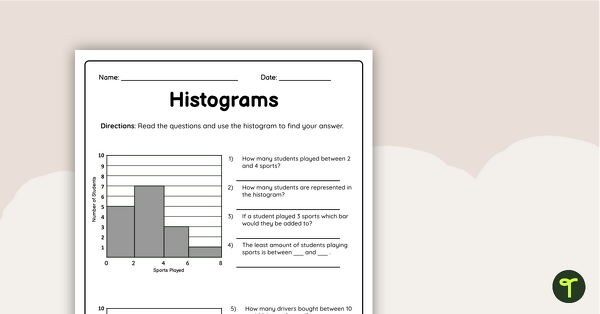
Histograms Worksheet
Encourage your students to practise reading and creating histogram graphs using this double-sided worksheet with answer key included.