Introduce the concept of a pictograph, and teach students how to create simple pictographs based on data from in a word problems.
Pictograph Fun! Using Data to Create Simple Pictographs
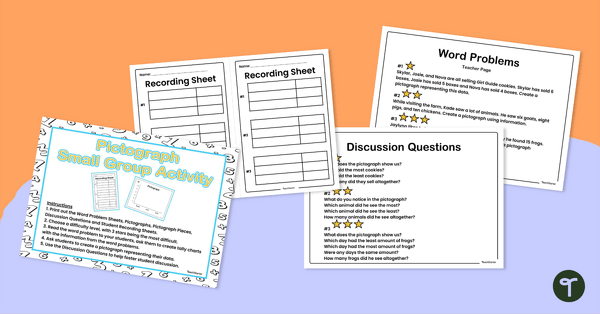
If your young students are discovering the fun of pictographs, this resource will make their next maths lesson! Perfect for small-group or individual work time, these differentiated cards provide simple instructions to gradually display more complex data as pictographs (also known as ‘picture graphs’).
This resource kit contains:
- directions,
- sheet of 3 leveled word problems,
- sheet of discussion questions,
- 3 pictographs and pieces, and
- answer keys.
Teaching About Interpreting and Creating Pictographs
Pictographs, or pictorial representations of data, feature significantly in the Statistics strand of the Maths Curriculum. They play a significant role in early years mathematics for several reasons. Pictographs are engaging and accessible to young learners because they utilise familiar images or symbols. Children can relate to the pictures and find them more interesting than purely numerical data. This engagement fosters interest and curiosity in mathematics from an early age.
Tips for Differentiation + Scaffolding
A team of dedicated, experienced educators created this resource to support your pictograph lessons.
In addition to individual student work time, use this graphing activity to enhance learning through guided maths groups, whole class lessons, or individual assessment tasks.
If you have a mixture of above and below-level learners, check out these suggestions for keeping students on track with the concepts:
🆘 Support Struggling Students
Choose the lowest level of difficulty task and guide students when completing the recording sheets.
➕ Challenge Fast Finishers
Choose the highest level of difficulty, then ask students to complete basic computations using the graph’s data.
Ask students to create their own word problems and graphs and record them in their books.
Easily Prepare This Resource for Your Students
Use the dropdown icon on the Download button to choose between the PDF or Google Slides version of this resource. A recording sheet and answer key are also included with this download.
Print out the Word Problem Sheets, Pictographs, Pictograph Pieces, Discussion Questions, and Student Recording Sheets. Choose the appropriate difficulty level for your learners (with 3 stars being the most difficult). Read the word problem to your students, and ask them to create tally charts with the information from the word problems. Ask students to create a pictograph representing their data. Use the Discussion Questions to help foster student discussion.
This resource was created by Brittany Kellogg, a Teach Starter Collaborator.
Don’t stop there! We’ve got more pictographs activities and resources that cut down on lesson planning time:
[resource:4963868][resource:4961213][resource:4963853]


0 Comments
Write a review to help other teachers and parents like yourself. If you'd like to request a change to this resource, or report an error, select the corresponding tab above.