Use data analysis skills to match frequency tables with a corresponding bar graph or pictograph.
📊 Practise Matching Bar Graphs and Pictographs
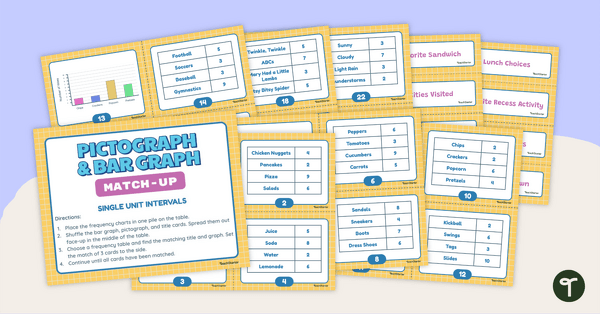
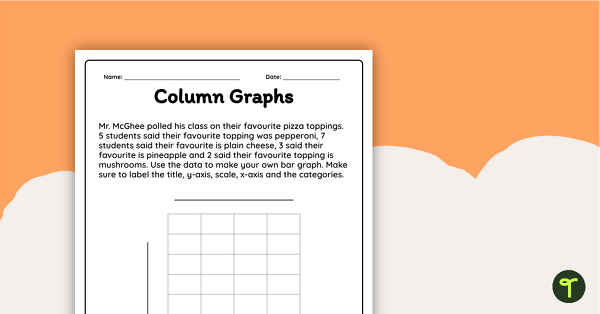
Bar graphs, pictographs, frequency tables … OH MY! Are your students practising how to analyse different types of graphs? As we all know, graphs are an excellent way to display data or information visually. Once your students learn the basics of how to read each type of graph, answering questions and analysing the data will be a breeze! Why not practise matching data to its corresponding chart while having fun? With this resource, students will have experience matching frequency tables with a single-unit bar graph or pictograph.
To play:
- Place the frequency tables in one pile on the table.
- Shuffle the bar graph, pictograph, and title cards. Spread them out face-up in the middle of the table.
- Choose a frequency table and find the matching title and graph.
- Set the match of 3 cards to the side.
- Continue until all cards have been matched.
Through this activity, students will show they can interpret bar graphs and pictographs by matching each with a corresponding frequency table.
Tips for Differentiation + Scaffolding
A team of dedicated, experienced educators created this resource to support your maths lessons.
In addition to individual student work time, use this data analysis activity to enhance learning through guided maths groups or whole class lessons.
If you have a mixture of above and below-level learners, check out these suggestions for keeping students on track with the concepts:
🆘 Support Struggling Students
Help students who need help understanding the concepts by limiting the number of cards they are required to match. Additionally, students can complete this activity in a 1-on-1 setting or with a small group.
➕ Challenge Fast Finishers
For students who may need a bit of a challenge, encourage them to create a dot plot to display the same set of data. Students can draw the charts on either a separate piece of paper or on a whiteboard.
For further extension, challenge your higher-ability students to our Scaled-Interval Graphs Match Up.
Easily Prepare This Resource for Your Students
Use the dropdown icon on the Download button to choose between the PDF or editable Google Slides version of this resource.
Print on card for added durability and longevity. Place all pieces in a folder or large envelope for easy access.
This resource was created by Allie Kleijnjans, a teacher and Teach Starter Collaborator.
Don’t stop there! We’ve got more activities and resources that cut down on lesson planning time:
teaching resource
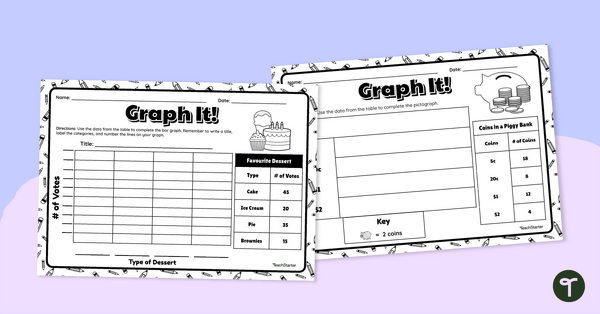
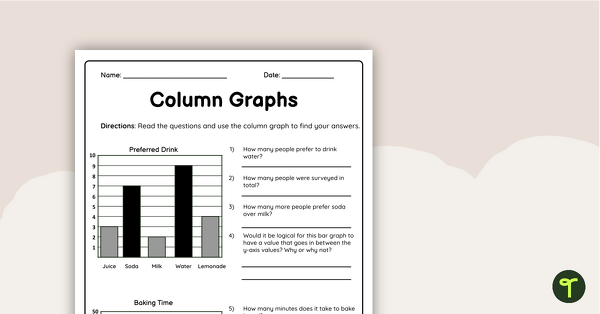
Graph It! Worksheet (Many-to-One Graphs)
Draw a scaled picture graph and bar graph to represent data with this worksheet.

teaching resource
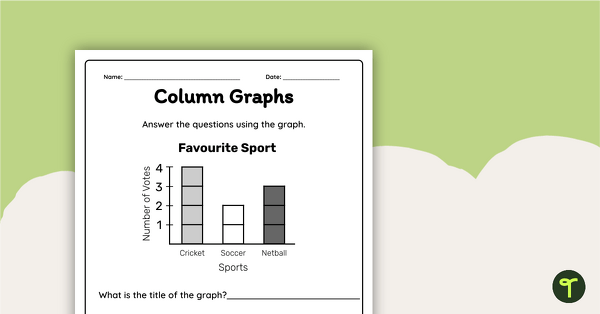
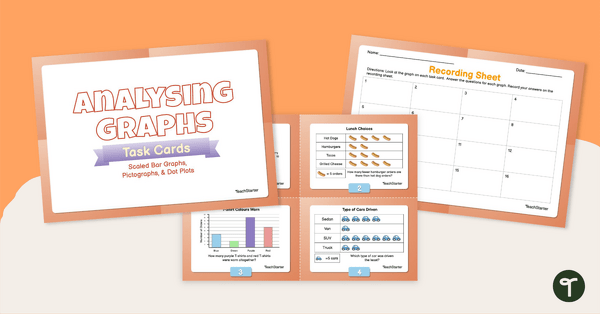
Analysing Graphs – Single-Unit Bar Graphs and Pictographs – Task Cards
Use data analysis skills to analyse bar graphs and pictographs with this set of task cards.

teaching resource
Types of Graphs Posters
Show students the varying data displays they will encounter in their primary maths lessons with these colourful and easy-to-digest visual posters.


0 Comments
Write a review to help other teachers and parents like yourself. If you'd like to request a change to this resource, or report an error, select the corresponding tab above.