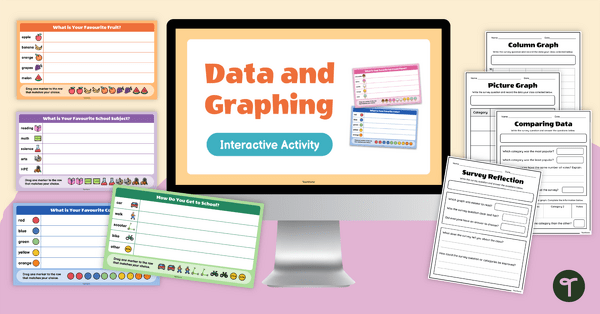
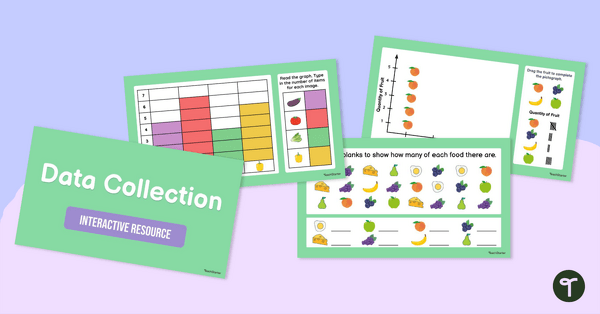
Explore data collection and graphing with this interactive resource, designed to help Year 2 students collect, represent and interpret data.
Data and Graphing Activities for Year 2
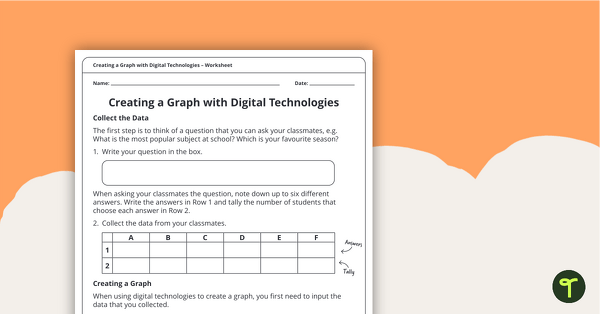
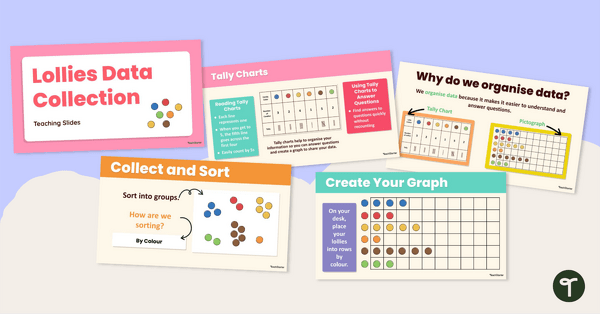
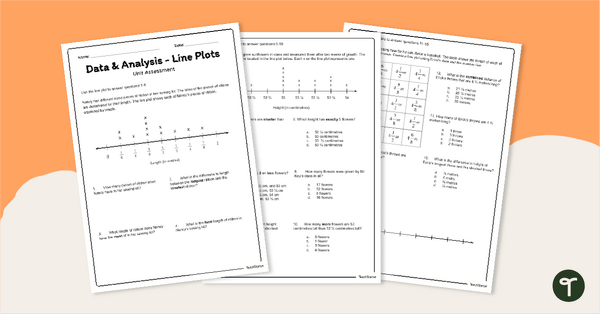
Understanding how to collect, organise and interpret data is an important part of early mathematical learning. This resource helps students investigate questions, gather information and represent their findings using a variety of graph types and data displays.
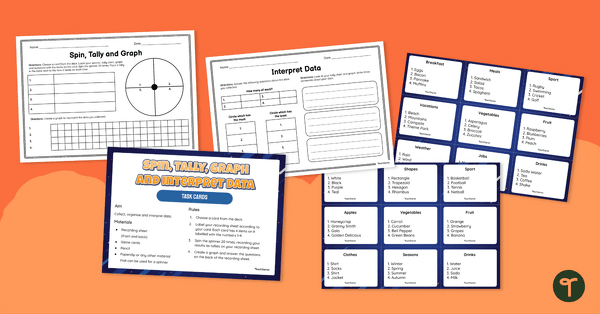
This interactive data and graphing resource has been designed to provide meaningful opportunities for students to work with real-world data. Students create and interpret graphs, compare results and answer questions about the information they have collected.
The resource includes:
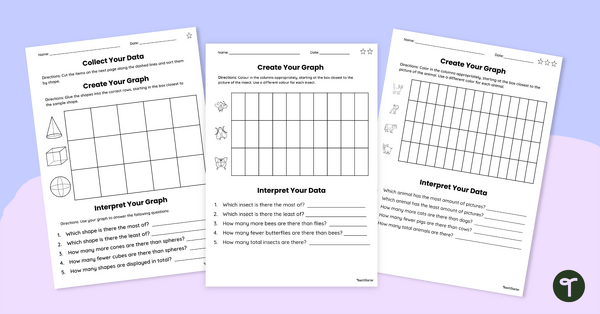
- Column graph templates.
- Picture graph templates.
- Data collection activities.
- Data comparison tasks.
- Survey reflection activities.
- Interactive digital graphing slides.
Through these activities, students develop confidence in collecting data, representing information visually and making observations about their results.
Flexible Data and Graphing Activities for the Classroom
This resource can be used in a variety of engaging ways:
- Class Surveys – Have students collect data about favourite foods, pets, colours or hobbies before creating graphs to represent the results.
- Maths Rotations – Use the templates and digital slides as part of small-group activities focused on data collection and interpretation.
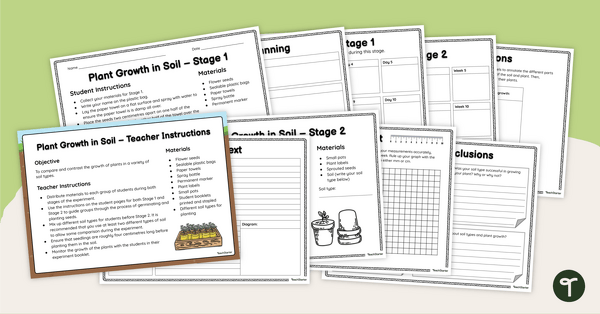
- Real-World Data Investigations – Encourage students to gather information from the classroom or playground and display their findings using different graph types.
The mix of printable and digital activities makes it easy to support a range of learning styles while building data literacy skills.
Download These Data and Graphing Activities Today
Making data and graphing lessons engaging is simple with this ready-to-use resource.
This resource is available as a ready-to-download PDF and an interactive Google Slides version. Use the Download button to access your preferred format. Please note that you will be prompted to make your own copy of the Google Slides file before editing and assigning it to students.
This resource was created by Lindsey Phillips, a TeachStarter collaborator.
More Data and Graphing Resources
Discover more curriculum-aligned resources to help students collect, represent and interpret data with confidence.
Assign this data collection project to enable students to master the skills of acquiring and recording data.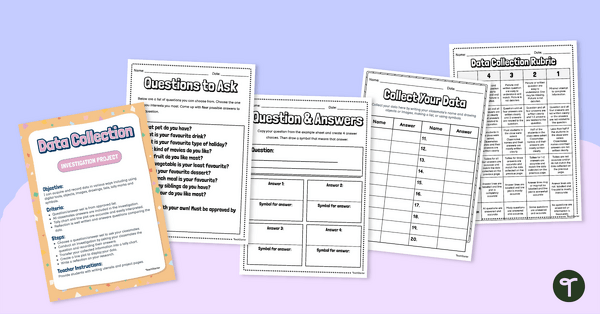
teaching resource
Data Collection Investigation Project
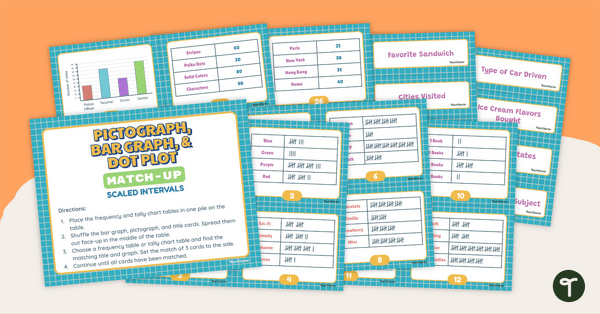
Use data analysis skills to match frequency tables with a corresponding bar graph or pictograph.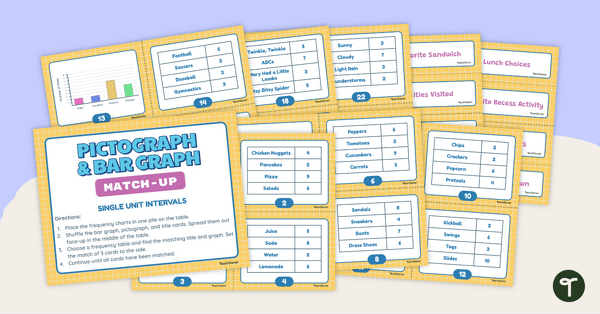
teaching resource
Pictograph and Bar Graph Match-Up (Single-Unit Intervals)
Use data analysis skills to analyse bar graphs and pictographs with this set of task cards.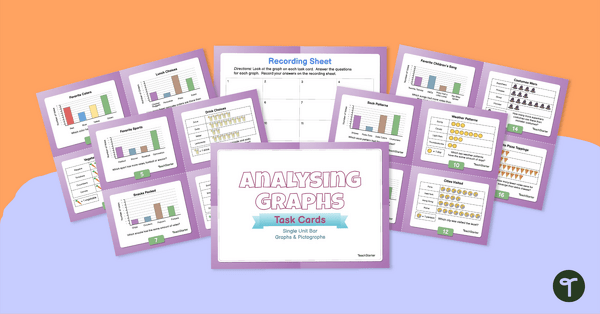
teaching resource
Analysing Graphs – Single-Unit Bar Graphs and Pictographs – Task Cards

0 Comments
Write a review to help other teachers and parents like yourself. If you'd like to request a change to this resource, or report an error, select the corresponding tab above.