Explore this candy-themed data collection teaching presentation to teach students the basics of acquiring and recording data.
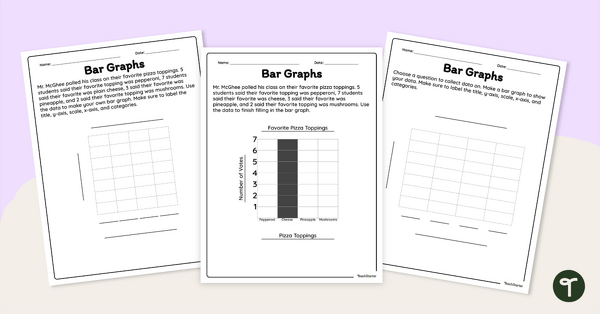
Data Collection Teaching Presentation
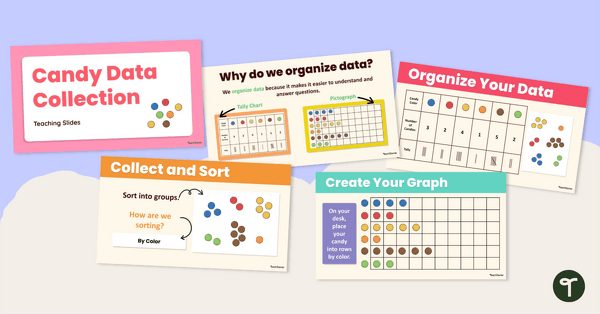
Introduce your students to the concepts of collecting and recording data with this interactive and engaging candy-themed slide deck! This teaching presentation is focused on data collection, and steps students through how to sort and record data using objects and symbols all children are familiar with: candy!
This 20-slide presentation includes activities for students to engage with and for teachers to use as knowledge and understanding checks throughout the exercise.
Teach Effective Data Skills
With this data collection teaching resource, students can master the art of acquiring and recording data through four essential steps, where students will:
- Collect and sort: sort the objects by their features, in this case, their color.
- Organize: count the number of candies in each color group. Record in numerals and with tally marks.
- Create your graph: create a pictograph on their desks by placing the candy/counters in rows.
- Interpret: turn and talk to a friend, and answer the questions about their findings.
This process is repeated for pictographs and bar graphs, with a modeled example being displayed, and a subsequent student activity for each graph type.
This resource was created by Kaylyn Chupp, a teacher in Florida and Teach Starter Collaborator.
Looking for More Great Graphs and Data Resources?
Prepare your students for a future where data literacy is essential. Unlock the potential of data and graphs in the classroom, making learning an interactive and exciting journey.
[resource:2652042] [resource:2668294] [resource:4994191]

0 Comments
Write a review to help other teachers and parents like yourself. If you'd like to request a change to this resource, or report an error, select the corresponding tab above.