Graphing Teaching Resources
Teach graphing this school year with printable worksheets, fun graphing activities and games, task cards and more teacher-created resources for elementary school math!
This collection of editable teacher-created resources is aligned with the Common Core curriculum. It has been carefully reviewed by the expert teachers on the Teach Starter team to ensure every single digital or printable resource is ready to use in the classroom. That means you can save hours on lesson planning with activities ready to print or use digitally!
Are you looking to learn more about teaching students to use graphs, or just on the hunt for fresh ideas and activities to engage your students? Read on for a primer from our teacher team, including a look graphing on this level and some key vocabulary!
What Is Graphing? A Kid-Friendly Definition
Graphing starts as early as kindergarten or first grade in many schools around the country with simple pictographs. But how do you explain what graphing is to the youngest students? This kid-friendly definition may help.
Graphing is a way to show information using pictures and symbols. It's sort of like drawing a picture that helps you understand numbers and facts.
For example, we could use graphs to show how many kids in our class like different colors or how many toys in the toy bin are cars.
Graphing Vocabulary for Elementary Teachers
Looking for a guide to some of the graphing vocabulary your students will encounter — and you will have to define? Here's a comprehensive look, along with some simple definitions!
- Data —Information that is collected and analyzed
- Axis — The horizontal and vertical lines that make up a graph.
- X-axis — The horizontal axis on a graph
- Y-axis — The vertical axis on a graph
- Bar — A rectangular shape we use to represent data on a bar graph
- Scale — The units used to measure data on a graph
- Pictogram/pictograph — A graph that uses pictures to represent data
- Legend/key — A chart that explains the symbols used on a graph (students may recognize this from their map skills lessons)
- Line of best fit — A straight line on a graph that represents the overall trend in a set of data
- Line plot — A graph that shows the frequency of data values on a number line
- Tally — A mark used to represent data on a tally chart
- Pie chart — A graph that shows the proportion of each data value to the whole, represented as a circle that looks like a pie
- Line graph — A graph that shows the relationship between two variables using a line
- Data point — An individual value on a graph
- Free Plan
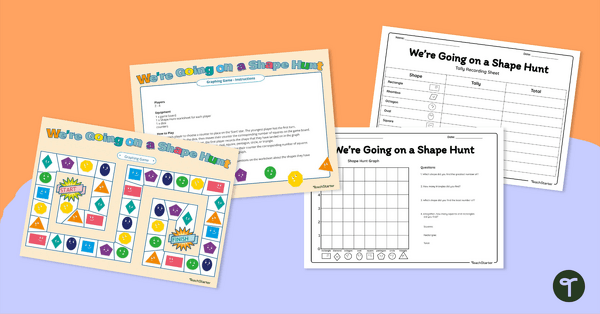
We're Going On a Shape Hunt! Graphing Game
Consolidate students' knowledge of 2D shapes while teaching about data collection, recording and graphing!
- Free Plan
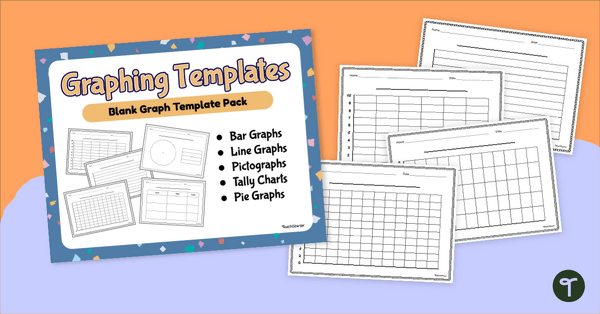
Blank Graph Template Pack
Construct your own graphs with a printable set of Blank Graph Templates.
- Free Plan
Free Printable Graph Paper — Centimeter Grid Paper
A piece of centimeter grid paper to be used in a multitude of ways.
- Plus Plan
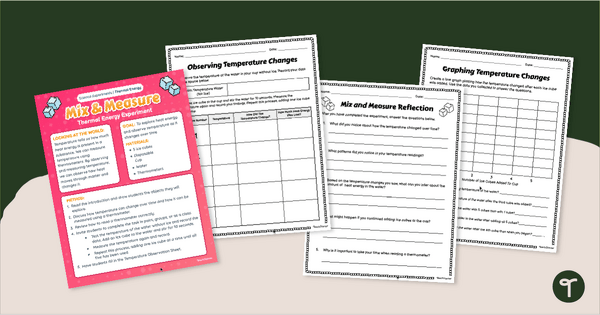
Mix & Measure Temperature Experiment
Explore temperature changes and practice reading a thermometer with our Mix and Measure Temperature Experiment.
- Plus Plan
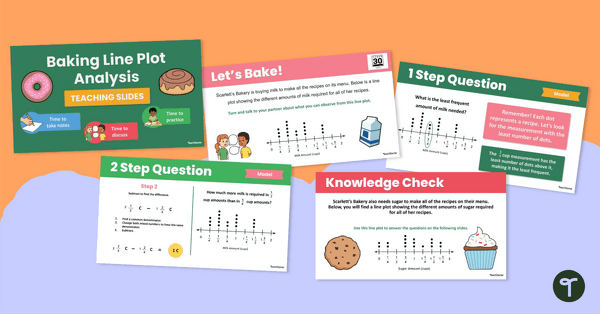
Baking Line Plot Analysis Teaching Slides
Explore the sweet side of graphs and data with this bakery-themed line plot resource, supporting your students' abilities to interpret line plots!
- Plus Plan
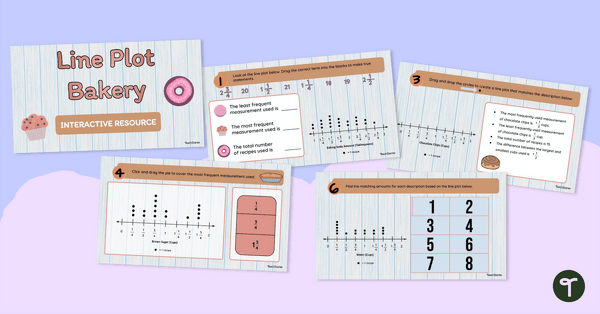
Dot Plot Bakery Interactive Activity
Strengthen dot plot skills with this bakery-themed interactive activity, designed to help students practice creating and analyzing dot graphs in a fun, structured way.
- Free Plan
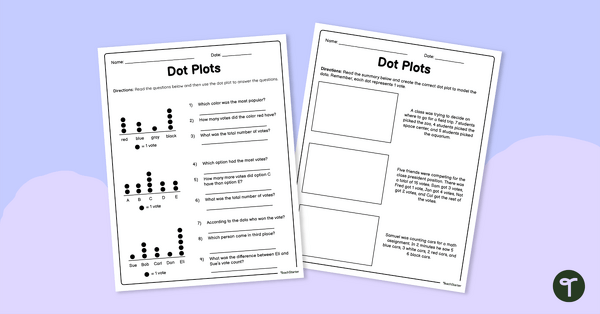
Dot Plot Worksheet for 2nd Grade
Practice analyzing and creating single-unit dot plots with this free math worksheet for 2nd-grade students.
- Plus Plan
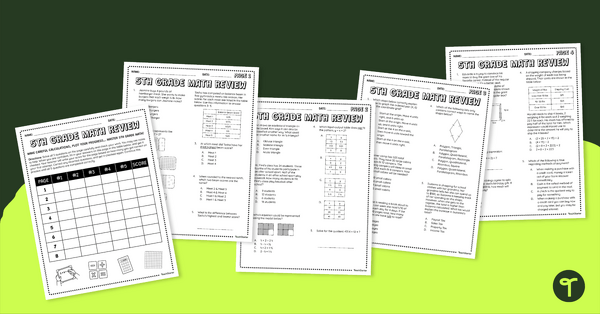
5th Grade Math Review – Test Prep Packet
Encourage your students to work through 8 pages of 5th-grade math problems while charting their progress to measure their success.
- Free Plan
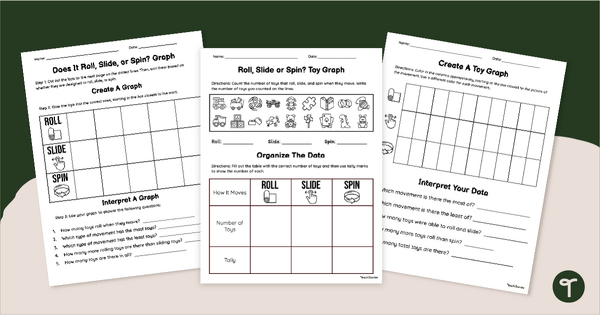
How Does It Move? Toy Graphing Worksheets
Explore motion and mathematics with engaging Toy Graphing Worksheets.
- Plus Plan
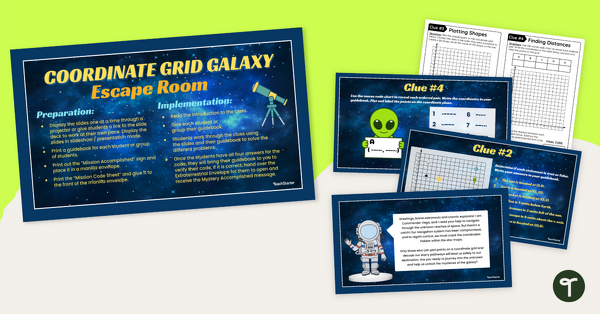
Coordinate Plane Escape Room
Play this engaging coordinate plane escape room with your students to help them refine their coordinate grid skills.
- Free Plan
Isometric Paper Templates - Dotted/Lined
Isometric Paper - Dotted Paper Printable
- Free Plan
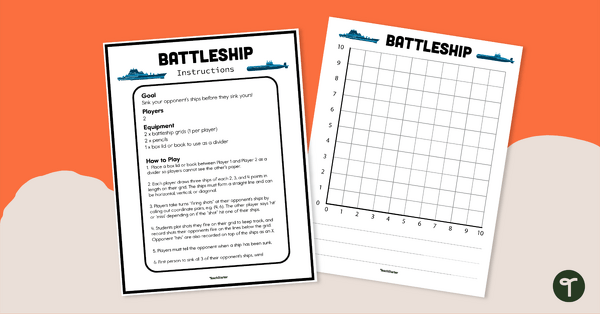
Battleship Coordinate Plane Game
Use this coordinate plane game to practice plotting ordered pairs on the coordinate grid.
- Free Plan
Count and Graph Worksheet Pack
Explore counting and graphing skills with this set of three worksheets.
- Plus Plan
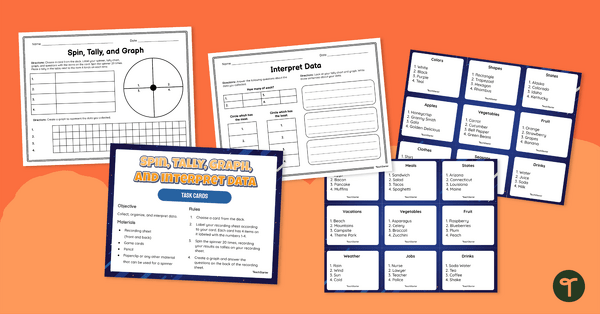
Spin, Tally, Graph and Interpret Data – Task Card Activity
Guide your students to collect data, make tally marks, create a bar graph and analyze data with this math activity designed for 1st and 2nd-grade students.
- Plus Plan
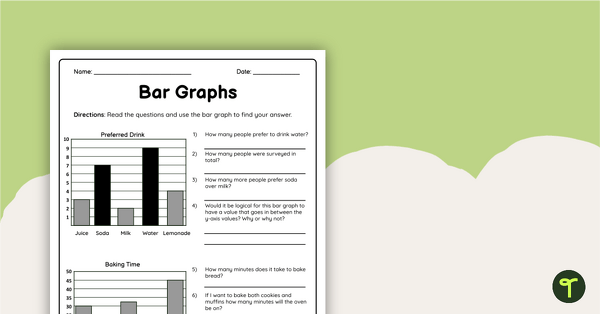
Bar Graphs Worksheet
Use this double-sided bar graphs worksheet to check your students’ understanding of interpreting and drawing bar graphs.
- Plus Plan
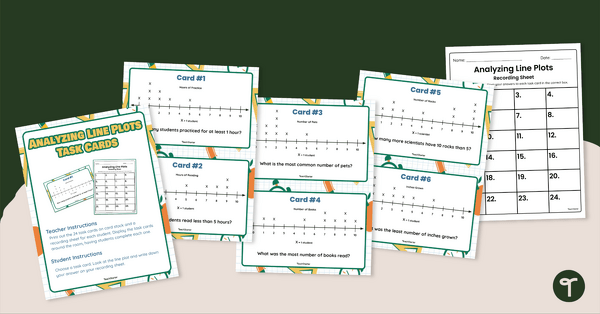
Analyzing Dot Plots Task Cards
Strengthen data analysis skills by interpreting dot plots with this set of 24 task cards.
- Plus Plan
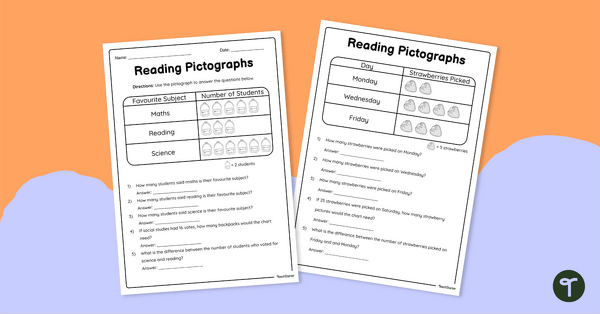
Reading Pictographs - Worksheets
Use this double-sided worksheet to enable students to practice reading and interpreting pictographs.
- Plus Plan
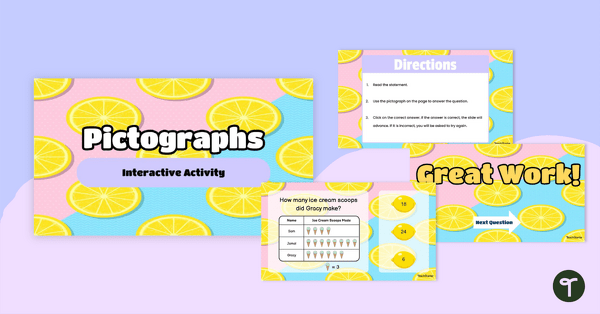
Pictographs - Interactive Activity
Use this fun and engaging interactive activity to aid students. in practicing their pictograph interpretation skills.
- Plus Plan
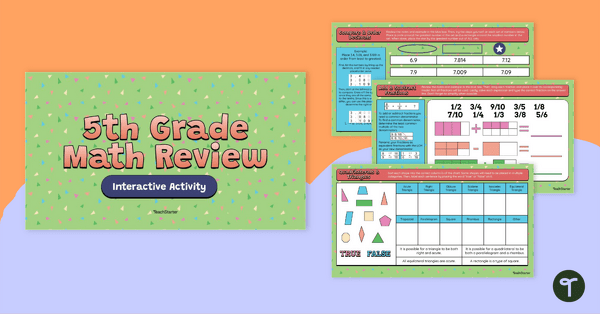
5th Grade Math Review – Google Slides Interactive Activity
Review important 5th-grade math standards with a student-led interactive activity that covers 12 different mathematical concepts.
- Plus Plan
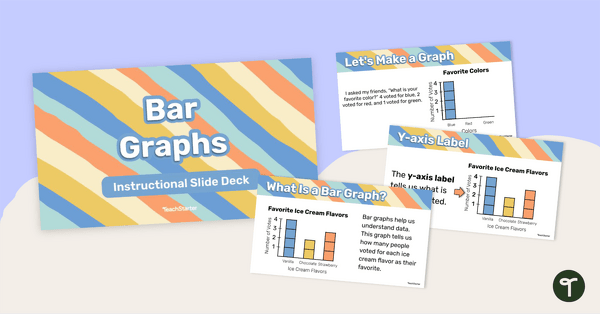
Bar Graphs – Instructional Slide Deck
Learn about the features and how to create a bar graph with this 25-page instructional slide deck.
- Plus Plan
Picture Graph Templates
A set of blank picture graph templates for students to represent data.
- Plus Plan
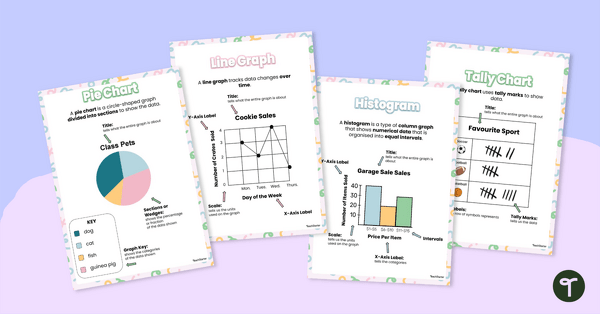
Types of Graphs Posters
This colorful and easy-to-digest visual display shows students the varying data displays they will encounter in their elementary math lessons.
- Plus Plan
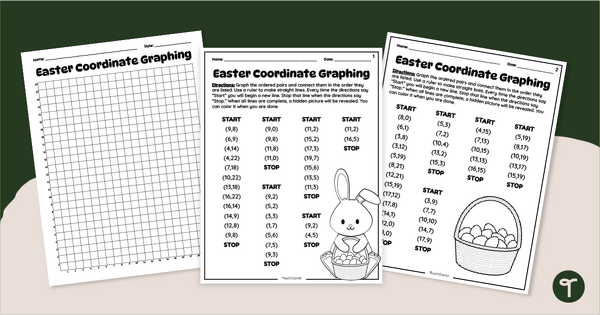
Easter Coordinate Graphing Worksheets
Hop into your study of ordered pairs with Easter Coordinate Graphing Worksheets.
- Plus Plan
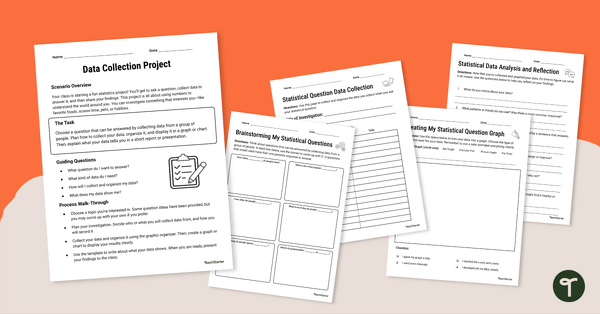
Data Collection Project
Complete this data collection project with your students to give them practice developing a statistical question, collecting data, and displaying the results.
- Plus Plan
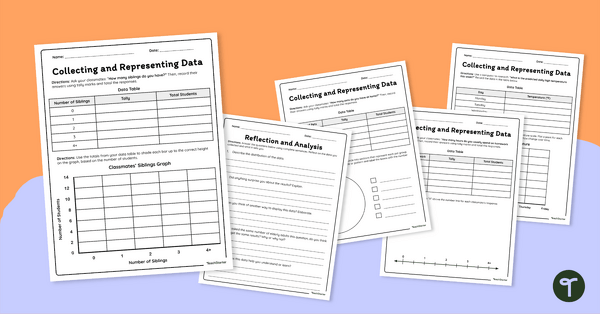
Collecting and Representing Data Worksheet Set
Download our collecting and representing data worksheet set to get your students collecting, organizing, and displaying data.
- Plus Plan
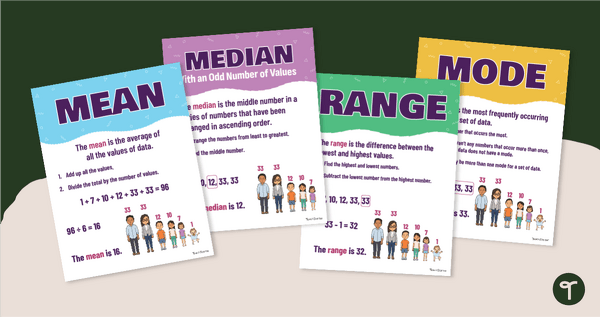
Range, Mean, Median & Mode Chart Pack
Download a Range, Mean, Median & Mode Chart pack to help your students remember measures of central tendency.
- Plus Plan
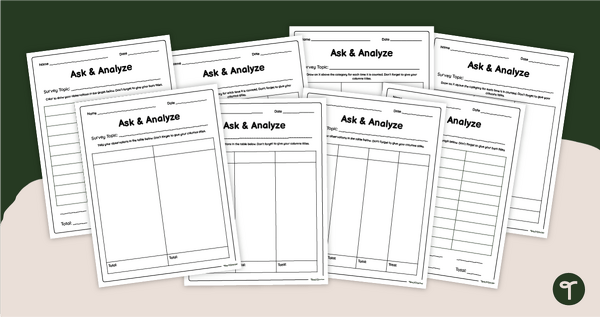
Data Collection Worksheets - Blank Survey Template
Organize student survey data with a set of printable survey data collection worksheets.
- Plus Plan
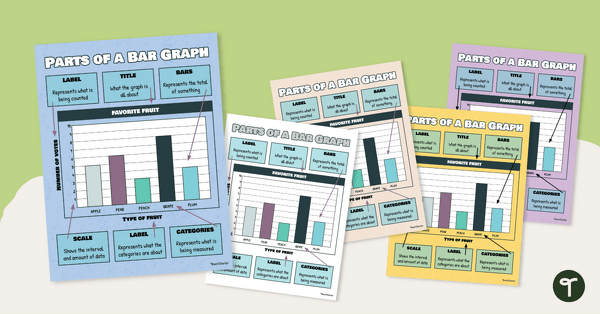
Bar Graph Anchor Chart
Hang this bar graph anchor chart in your classroom to teach your students about the different parts of this commonly used graph.
- Plus Plan
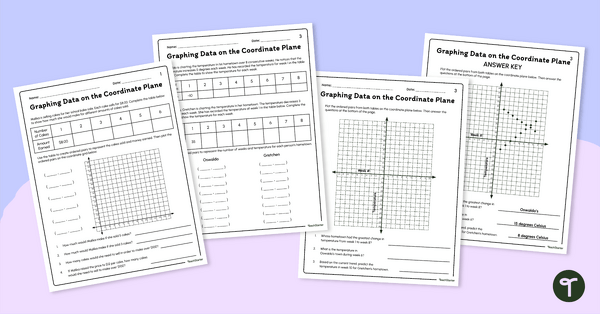
Graphing Data Worksheets (Coordinate Plane)
Introduce these graphing data worksheets to your students to give them practice graphing real-world situations on the coordinate plane.
- Plus Plan
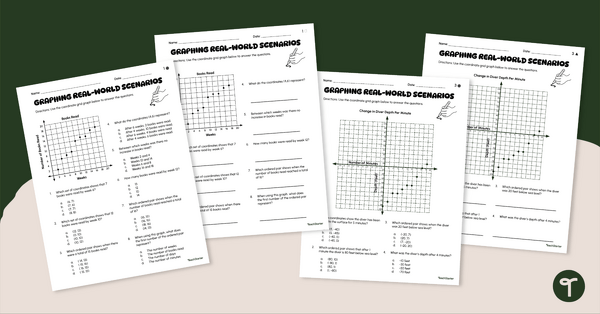
Real-World Math Problems on the Coordinate Plane Worksheet Set
Interpret real-world math problems on the coordinate plane with our differentiated worksheet set.
- Plus Plan
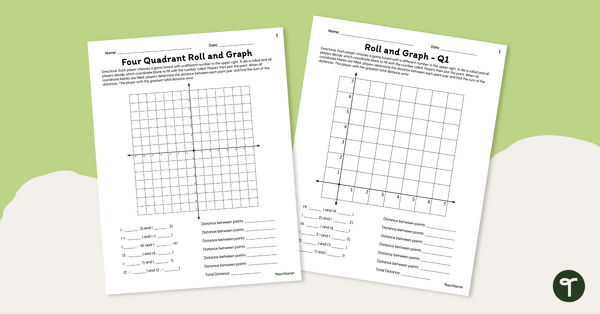
Coordinate Plane Games — "Roll and Graph"
Play our coordinate plane games in your classroom to enhance students’ ability to plot points and find the distance between them.
- Free Plan
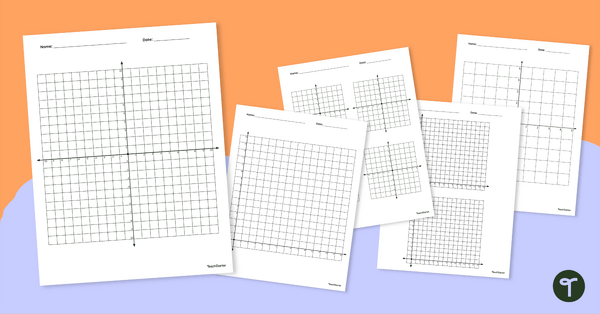
Coordinate Plane Printable Templates
Download these coordinate plane printable templates for use in your coordinate planes or graphing unit.