Australian Curriculum V8
ACMSP097
Evaluate the effectiveness of different displays in illustrating data features including variability
Show more
6
teaching resources for those 'aha' moments
- Plus Plan
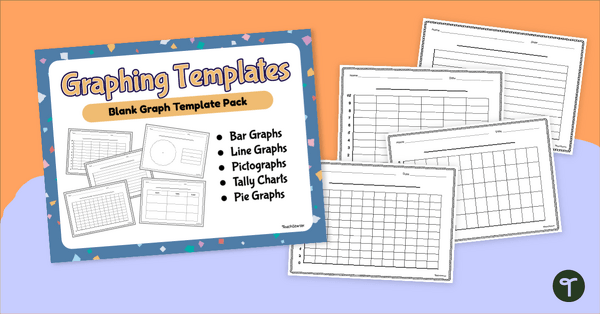
Blank Graph Template Pack
Construct your own graphs with a printable set of Blank Graph Templates.
- Plus Plan
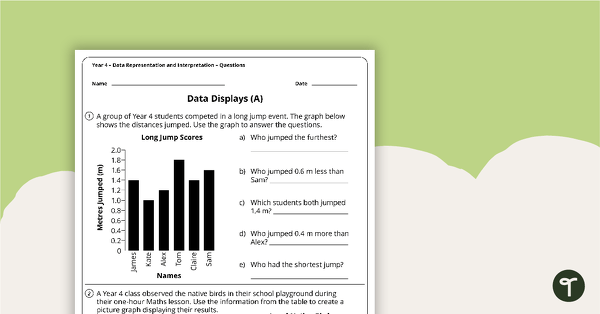
Data Representation and Interpretation Worksheets - Year 4
4 data representation and interpretation worksheets linked to the Australian Curriculum.
- Plus Plan

Data Maths Investigation - Which Reward?
A mathematics investigation involving data collection and representation, embedded in a real-world context.
- Plus Plan
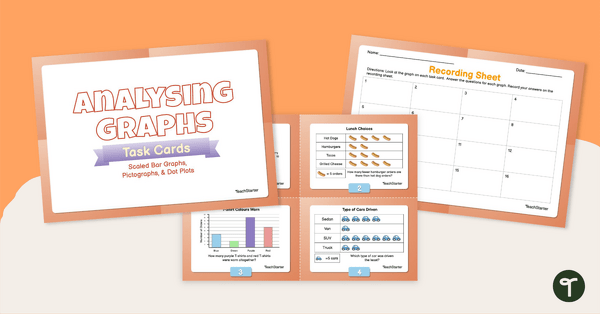
Analysing Graphs — Scaled Bar Graphs, Pictographs, & Dot Plots —Task Cards
Use data analysis skills to analyse scaled bar graphs, pictographs, and dot plots with this set of task cards.
- Plus Plan

Types of Graphs Posters and Worksheets
A collection of posters displaying the different types of graphs along with matching worksheets to assist students with laying out graphs on the page.
- Plus Plan
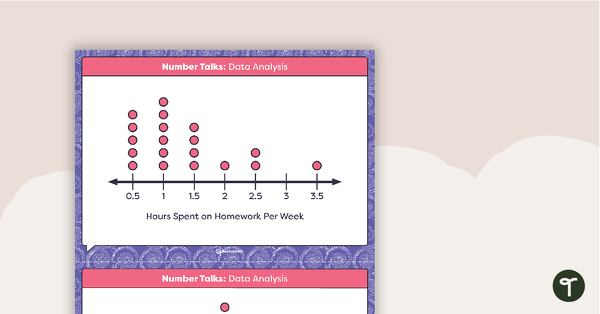
Number Talks - Data Analysis Task Cards
Build data analysis skills with this set of 26 task cards.